Using the descriptive statistics above, find the sample variance.

Glencoe Algebra 1, Student Edition, 9780079039897, 0079039898, 2018
18th Edition
ISBN:9780079039897
Author:Carter
Publisher:Carter
Chapter10: Statistics
Section10.4: Distributions Of Data
Problem 19PFA

Related questions
Question
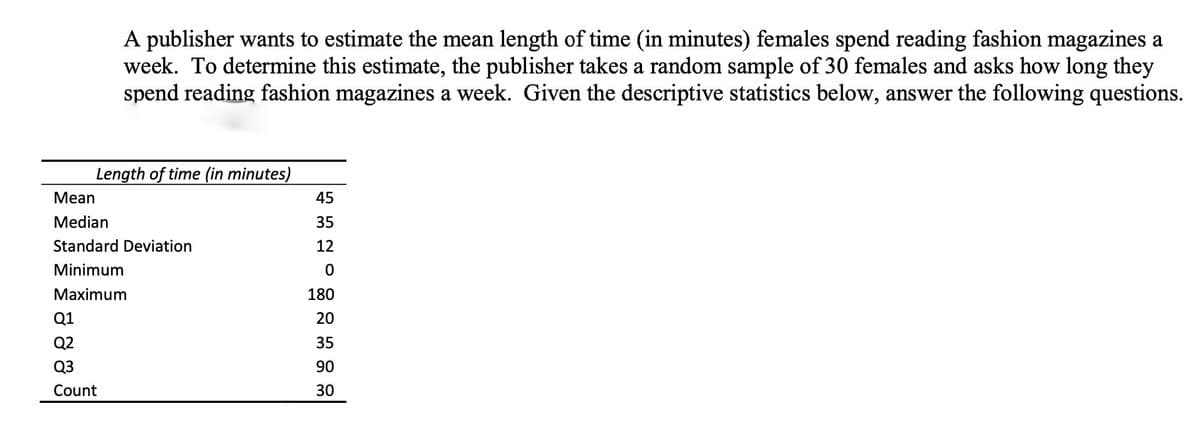
Transcribed Image Text:A publisher wants to estimate the mean length of time (in minutes) females spend reading fashion magazines a
week. To determine this estimate, the publisher takes a random sample of 30 females and asks how long they
spend reading fashion magazines a week. Given the descriptive statistics below, answer the following questions.
Length of time (in minutes)
Мean
45
Median
35
Standard Deviation
12
Minimum
Маximum
180
Q1
20
Q2
35
Q3
90
Count
30
Transcribed Image Text:B. Using the descriptive statistics above, find the sample variance.
Expert Solution
This question has been solved!
Explore an expertly crafted, step-by-step solution for a thorough understanding of key concepts.

Step by step
Solved in 2 steps

Recommended textbooks for you
Glencoe Algebra 1, Student Edition, 9780079039897…
Algebra
ISBN:
9780079039897
Author:
Carter
Publisher:
McGraw Hill
Glencoe Algebra 1, Student Edition, 9780079039897…
Algebra
ISBN:
9780079039897
Author:
Carter
Publisher:
McGraw Hill