Determine the Lift chart and the ROC curve (show the table also) for the below data (w come of Yes or No). Show your work. ample# Actual Predicted probability of class Yes Yes 0.85 No 0.70 Yes 0.95 Yes 0.4 No 0.75 No 0.65 Yes 0.99 Yes 0.98 No 0.55
Determine the Lift chart and the ROC curve (show the table also) for the below data (w come of Yes or No). Show your work. ample# Actual Predicted probability of class Yes Yes 0.85 No 0.70 Yes 0.95 Yes 0.4 No 0.75 No 0.65 Yes 0.99 Yes 0.98 No 0.55

Operations Research : Applications and Algorithms
4th Edition
ISBN:9780534380588
Author:Wayne L. Winston
Publisher:Wayne L. Winston
Chapter17: Markov Chains
Section17.6: Absorbing Chains
Problem 7P

Related questions

Question
6
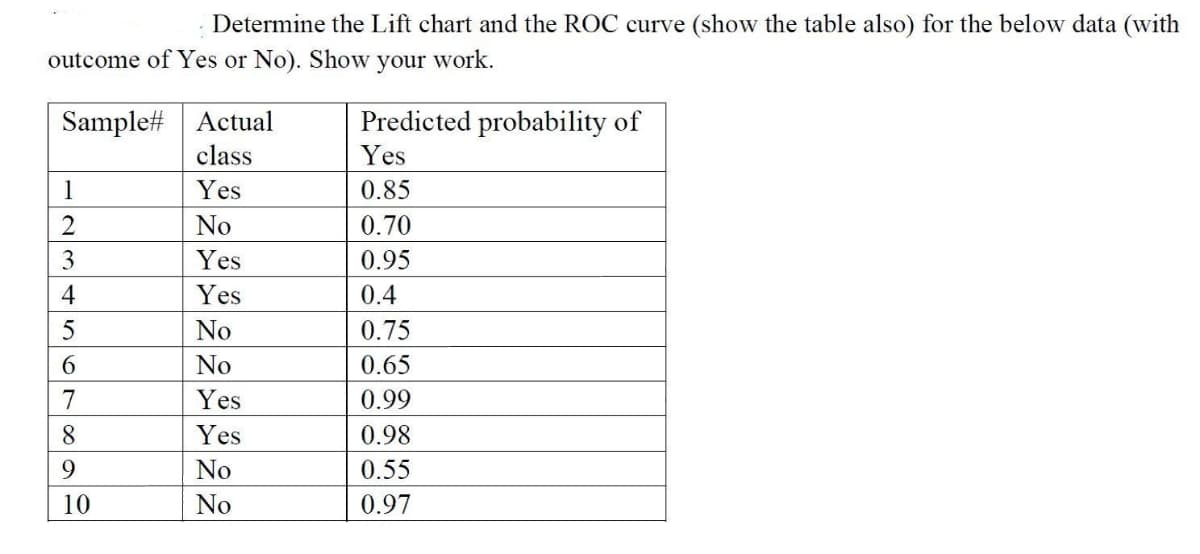
Transcribed Image Text:Determine the Lift chart and the ROC curve (show the table also) for the below data (with
outcome of Yes or No). Show your work.
Sample# Actual
Predicted probability of
class
Yes
1
Yes
0.85
2
No
0.70
3
Yes
0.95
4
Yes
0.4
5
No
0.75
6
No
0.65
7
Yes
0.99
8
Yes
0.98
9
No
0.55
No
0.97
10
Expert Solution
This question has been solved!
Explore an expertly crafted, step-by-step solution for a thorough understanding of key concepts.

Step by step
Solved in 2 steps with 1 images

Knowledge Booster


Learn more about
Need a deep-dive on the concept behind this application? Look no further. Learn more about this topic, computer-science and related others by exploring similar questions and additional content below.Recommended textbooks for you
Operations Research : Applications and Algorithms
Computer Science
ISBN:
9780534380588
Author:
Wayne L. Winston
Publisher:
Brooks Cole
Operations Research : Applications and Algorithms
Computer Science
ISBN:
9780534380588
Author:
Wayne L. Winston
Publisher:
Brooks Cole