Determine the sample size for each year level given in the table below (Raw Data). Computation of sample sizes according to year level. Year Level Population Size per Grade Level First Year 515 Second Year 620 Third Year 490 Fourth Year 725 Fifth Year 925 Irregular 555 Total 3830
Determine the sample size for each year level given in the table below (Raw Data). Computation of sample sizes according to year level. Year Level Population Size per Grade Level First Year 515 Second Year 620 Third Year 490 Fourth Year 725 Fifth Year 925 Irregular 555 Total 3830

College Algebra (MindTap Course List)
12th Edition
ISBN:9781305652231
Author:R. David Gustafson, Jeff Hughes
Publisher:R. David Gustafson, Jeff Hughes
Chapter8: Sequences, Series, And Probability
Section8.7: Probability
Problem 5E: List the sample space of each experiment. Rolling one die and tossing one coin

Related questions
Topic Video
Question
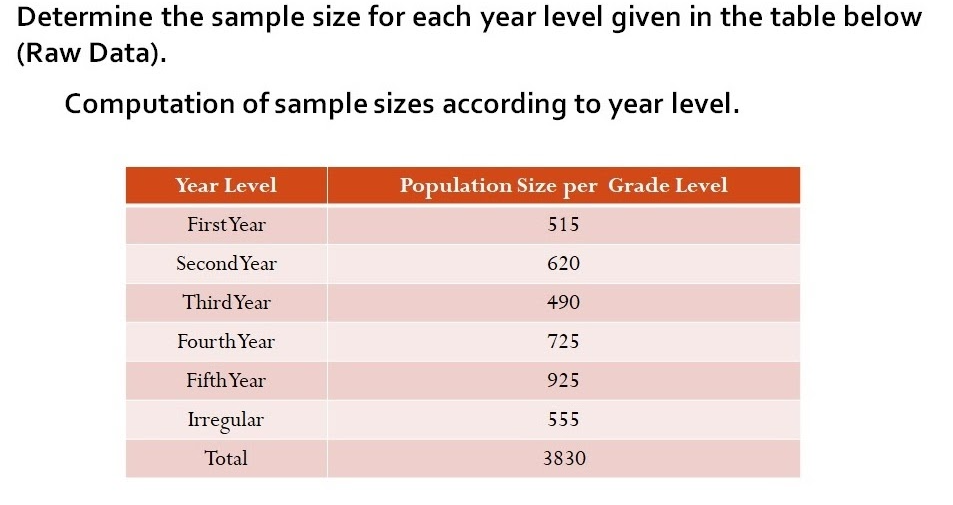
Transcribed Image Text:Determine the sample size for each year level given in the table below
(Raw Data).
Computation of sample sizes according to year level.
Year Level
Population Size per Grade Level
First Year
515
Second Year
620
Third Year
490
Fourth Year
725
Fifth Year
925
Irregular
555
Total
3830
Expert Solution
This question has been solved!
Explore an expertly crafted, step-by-step solution for a thorough understanding of key concepts.

Step by step
Solved in 3 steps

Knowledge Booster


Learn more about
Need a deep-dive on the concept behind this application? Look no further. Learn more about this topic, probability and related others by exploring similar questions and additional content below.Recommended textbooks for you
College Algebra (MindTap Course List)
Algebra
ISBN:
9781305652231
Author:
R. David Gustafson, Jeff Hughes
Publisher:
Cengage Learning

College Algebra (MindTap Course List)
Algebra
ISBN:
9781305652231
Author:
R. David Gustafson, Jeff Hughes
Publisher:
Cengage Learning