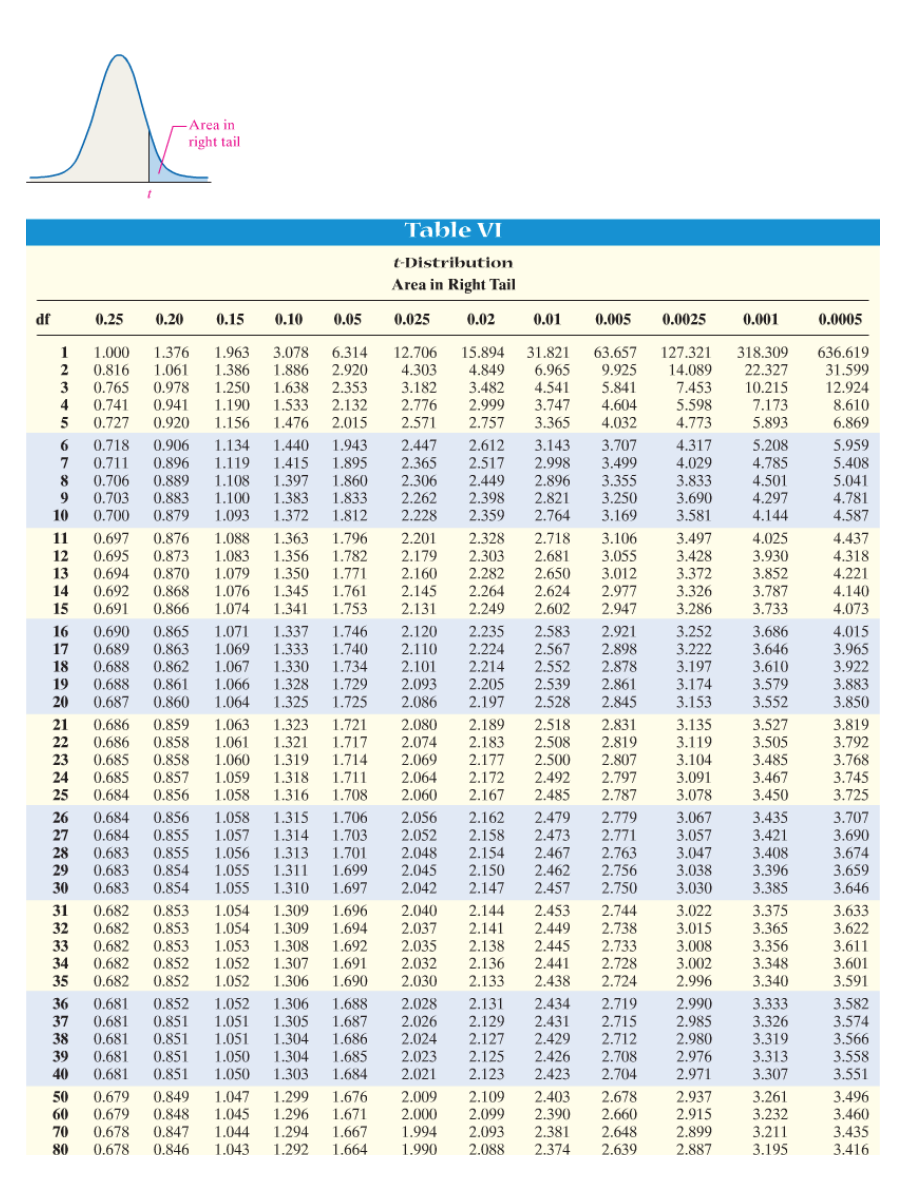
Determine the t-value in each of the cases. Click the icon to view the table of areas under the t-distribution. ..... (a) Find the t-value such that the area in the right tail is 0.01 with 20 degrees of freedom. 2.528 (Round to three decimal places as needed.) (b) Find the t-value such that the area in the right tail is 0.15 with 24 degrees of freedom. 1.059 (Round to three decimal places as needed.) (c) Find the t-value such that the area left of the t-value is 0.025 with 15 degrees of freedom. [Hint: Use symmetry.] - 2.131 (Round to three decimal places as needed.) (d) Find the critical t-value that corresponds to 50% confidence. Assume 25 degrees of freedom. (Round to three decimal places as needed.)
Determine the t-value in each of the cases. Click the icon to view the table of areas under the t-distribution. ..... (a) Find the t-value such that the area in the right tail is 0.01 with 20 degrees of freedom. 2.528 (Round to three decimal places as needed.) (b) Find the t-value such that the area in the right tail is 0.15 with 24 degrees of freedom. 1.059 (Round to three decimal places as needed.) (c) Find the t-value such that the area left of the t-value is 0.025 with 15 degrees of freedom. [Hint: Use symmetry.] - 2.131 (Round to three decimal places as needed.) (d) Find the critical t-value that corresponds to 50% confidence. Assume 25 degrees of freedom. (Round to three decimal places as needed.)

Chapter5: Exponential And Logarithmic Functions
Section5.5: Exponential And Logarithmic Models
Problem 4ECP

Related questions
Question
Question #1
Answer Part D only!!
Transcribed Image Text:Area in
right tail
Table VI
t-Distribution
Area in Right Tail
df
0.25
0.20
0.15
0.10
0.05
0.025
0.02
0.01
0.005
0.0025
0.001
0.0005
1
0.816
0.765
4
1.963
1.386
1.250
1.190
1.156
3.078
1.886
1.638
1.533
15.894
4.849
3.482
2.999
2.757
636.619
31.599
12.924
8.610
1.376
6.314
2.920
2.353
2.132
2.015
12.706
4.303
3.182
2.776
2.571
31.821
63.657
9.925
127.321
14.089
7.453
5.598
4.773
318.309
22.327
10.215
7.173
5.893
1.000
6.965
4.541
3.747
2
1.061
0.978
0.941
0.920
3
5.841
0.741
0.727
4.604
4.032
5
1.476
3.365
6.869
0.718
0.711
0.706
0.703
0.700
1.134
1.119
1.108
1.100
1.440
1.943
1.895
1.860
1.833
1.812
2.447
2.365
2.306
2.262
2.228
4.317
4.029
3.833
3.690
3.581
6
0.906
0.896
0.889
0,883
0.879
2.612
2.517
3.143
2.998
2.896
2.821
3.707
3.499
1.415
1.397
1.383
1.372
3.355
3.250
3.169
5.208
4.785
4.501
4.297
5.959
5.408
5.041
4.781
8
2.449
2.398
2.359
9
10
1.093
2.764
4.144
4.587
0.697
0.695
1.363
1.356
1.350
1.345
1.341
2.201
2.179
3.106
3.497
2.328
2.303
2.282
2.264
2.249
11
0.876
1.088
1.796
2.718
4.025
4.437
1.782
1.771
1.761
1.753
12
0.873
0.870
0.868
0.866
1.083
2.681
3.055
3.428
3.372
3.326
3.286
3.930
3.852
3.787
3.733
4.318
13
0.694
1.079
2.160
2.650
3.012
4.221
2.145
2.131
2.977
2.947
14
1.076
1.074
2.624
2.602
0.692
4.140
15
0.691
4.073
0.690
0.689
0.688
0.688
0.687
0.865
0.863
0.862
0.861
0.860
1.746
1.740
1.734
1.729
1.725
3.252
3.222
3.197
3.174
3.153
16
1.337
1.333
1.330
1.328
1.325
2.120
2.110
2.101
2.093
2.086
2.235
2.224
2.214
2.205
2.197
2.583
2.567
2.552
2.539
2.528
1.071
2.921
2.898
2.878
2.861
2.845
3.686
3.646
3.610
3.579
3.552
4.015
3.965
3.922
3.883
3.850
17
1.069
1.067
1.066
1.064
18
19
20
1.063
1.061
3.135
3.119
3.104
3.091
3.078
21
0.859
0.858
0.858
1.323
1.321
1.319
1.318
1.316
1.721
1.717
2.189
2.518
2.508
2.500
2.492
2.485
3.527
3.505
3.485
3.467
3.450
0.686
2.080
0.686
0.685
0.685
0.684
2.074
2.069
2.064
2.060
2.831
2.819
2.807
2.797
2.787
3.819
3.792
3.768
3.745
3.725
22
2.183
23
24
25
1.060
1.059
1.058
1.714
2.177
1.711
1.708
2.172
2.167
0.857
0.856
0.684
0.684
0.683
0.683
0.683
0.856
0.855
0.855
0.854
0.854
1.058
1.057
1.056
1.055
1.055
1.706
1.703
1.701
1.699
1.697
2.056
2.052
2.048
2.045
2.042
2.162
2.158
2.154
2.150
2.147
2.479
2.473
2.467
2.462
2.457
2.779
2.771
2.763
2.756
2.750
3.067
3.057
3.047
3.038
3.030
3.435
3.421
3.408
3.396
3.385
3.707
3.690
3.674
3.659
3.646
26
27
28
29
30
1.315
1.314
1.313
1.311
1.310
0.853
0.853
0.853
1.054
1.054
1.053
1.052
1.052
2.040
2.037
2.035
2.032
2.030
2.144
2.141
2.453
2.449
2.445
2.441
2.438
3.022
3.015
3.008
3.375
3.365
3.356
3.348
3.340
1.309
1.696
1.694
1.692
31
0.682
2.744
2.738
2.733
3.633
3.622
3.611
32
33
34
35
0.682
0.682
0.682
0.682
1.309
1.308
0.852
0.852
1.691
1.690
2.138
2.136
2.133
1.307
2.728
3.002
2.996
3.601
1.306
2.724
3.591
2.719
2.715
2.712
2.708
2.704
3.582
3.574
3.566
36
37
0.681
0.681
0.681
0.681
0.852
0.851
0.851
0.851
0.851
1.052
1.051
1.051
1.306
1.305
1.304
1.304
1.303
1.688
2.028
2.131
2.129
2.127
2.125
2.123
2.434
2.431
2.429
2.426
2.990
2.985
2.980
3.333
3.326
3.319
1.687
2.026
1.686
1.685
1.684
2.024
2.023
38
39
40
3.558
3.551
1.050
2.976
3.313
3.307
0.681
1.050
2.021
2.423
2.971
0.679
0.679
0.678
1.047
1.045
1.044
2.009
2.000
1.994
1.990
0.849
1.676
1.671
1.667
1.664
2.403
2.390
2.381
2.374
2.937
2.915
2.899
2.887
50
60
1.299
1.296
1.294
1.292
2.109
2.678
3.261
3.232
2.099
2.093
2.088
2.660
2.648
2.639
3.496
3.460
3.435
3.416
0.848
70
0.847
3.211
3.195
80
0.678
0.846
1.043
![Determine the t-value in each of the cases.
Click the icon to view the table of areas under the t-distribution.
.....
(a) Find the t-value such that the area in the right tail is 0.01 with 20 degrees of freedom.
2.528 (Round to three decimal places as needed.)
(b) Find the t-value such that the area in the right tail is 0.15 with 24 degrees of freedom.
1.059 (Round to three decimal places as needed.)
(c) Find the t-value such that the area left of the t-value is 0.025 with 15 degrees of freedom. [Hint: Use symmetry.]
- 2.131 (Round to three decimal places as needed.)
(d) Find the critical t-value that corresponds to 50% confidence. Assume 25 degrees of freedom.
(Round to three decimal places as needed.)](/v2/_next/image?url=https%3A%2F%2Fcontent.bartleby.com%2Fqna-images%2Fquestion%2F1c4fe1e3-d4cd-4be2-8052-f8d176e81bba%2F45662189-980f-43b4-9c59-75bee7a7129f%2Fer0e4ku_processed.png&w=3840&q=75)
Transcribed Image Text:Determine the t-value in each of the cases.
Click the icon to view the table of areas under the t-distribution.
.....
(a) Find the t-value such that the area in the right tail is 0.01 with 20 degrees of freedom.
2.528 (Round to three decimal places as needed.)
(b) Find the t-value such that the area in the right tail is 0.15 with 24 degrees of freedom.
1.059 (Round to three decimal places as needed.)
(c) Find the t-value such that the area left of the t-value is 0.025 with 15 degrees of freedom. [Hint: Use symmetry.]
- 2.131 (Round to three decimal places as needed.)
(d) Find the critical t-value that corresponds to 50% confidence. Assume 25 degrees of freedom.
(Round to three decimal places as needed.)
Expert Solution
This question has been solved!
Explore an expertly crafted, step-by-step solution for a thorough understanding of key concepts.

Step by step
Solved in 2 steps with 2 images

Recommended textbooks for you

Trigonometry (MindTap Course List)
Trigonometry
ISBN:
9781337278461
Author:
Ron Larson
Publisher:
Cengage Learning
Trigonometry (MindTap Course List)
Trigonometry
ISBN:
9781337278461
Author:
Ron Larson
Publisher:
Cengage Learning