Determine the test statistic for the interaction effect.

Glencoe Algebra 1, Student Edition, 9780079039897, 0079039898, 2018
18th Edition
ISBN:9780079039897
Author:Carter
Publisher:Carter
Chapter4: Equations Of Linear Functions
Section4.5: Correlation And Causation
Problem 11PPS

Related questions
Topic Video
Question
Determine the test statistic for the interaction effect.
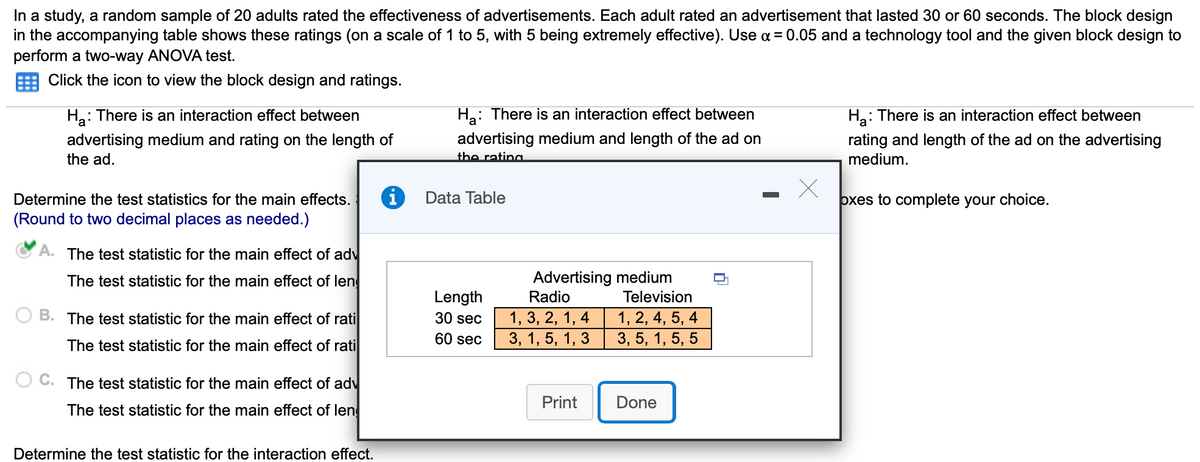
Transcribed Image Text:In a study, a random sample of 20 adults rated the effectiveness of advertisements. Each adult rated an advertisement that lasted 30 or 60 seconds. The block design
in the accompanying table shows these ratings (on a scale of 1 to 5, with 5 being extremely effective). Use a = 0.05 and a technology tool and the given block design to
perform a two-way ANOVA test.
Click the icon to view the block design and ratings.
Ha: There is an interaction effect between
Ha: There is an interaction effect between
На
: There is an interaction effect between
advertising medium and rating on the length of
the ad.
advertising medium and length of the ad on
the rating
rating and length of the ad on the advertising
medium.
Determine the test statistics for the main effects.
Data Table
oxes to complete your choice.
(Round to two decimal places as needed.)
A. The test statistic for the main effect of adv
Advertising medium
Radio
The test statistic for the main effect of len
Length
Television
1, 3, 2, 1, 4
3, 1, 5, 1, 3
B. The test statistic for the main effect of rati
1, 2, 4, 5, 4
3, 5, 1, 5, 5
30 sec
60 sec
The test statistic for the main effect of rati
C. The test statistic for the main effect of adv
Print
Done
The test statistic for the main effect of len
Determine the test statistic for the interaction effect.
Transcribed Image Text:Determine the test statistic for the interaction effect.
F =
(Round to two decimal places as needed.)
Enter your answer in the answer box and then click Check Answer.
Expert Solution
This question has been solved!
Explore an expertly crafted, step-by-step solution for a thorough understanding of key concepts.

Step by step
Solved in 2 steps with 1 images

Knowledge Booster


Learn more about
Need a deep-dive on the concept behind this application? Look no further. Learn more about this topic, statistics and related others by exploring similar questions and additional content below.Recommended textbooks for you
Glencoe Algebra 1, Student Edition, 9780079039897…
Algebra
ISBN:
9780079039897
Author:
Carter
Publisher:
McGraw Hill

Holt Mcdougal Larson Pre-algebra: Student Edition…
Algebra
ISBN:
9780547587776
Author:
HOLT MCDOUGAL
Publisher:
HOLT MCDOUGAL

Big Ideas Math A Bridge To Success Algebra 1: Stu…
Algebra
ISBN:
9781680331141
Author:
HOUGHTON MIFFLIN HARCOURT
Publisher:
Houghton Mifflin Harcourt
Glencoe Algebra 1, Student Edition, 9780079039897…
Algebra
ISBN:
9780079039897
Author:
Carter
Publisher:
McGraw Hill
Holt Mcdougal Larson Pre-algebra: Student Edition…
Algebra
ISBN:
9780547587776
Author:
HOLT MCDOUGAL
Publisher:
HOLT MCDOUGAL
Big Ideas Math A Bridge To Success Algebra 1: Stu…
Algebra
ISBN:
9781680331141
Author:
HOUGHTON MIFFLIN HARCOURT
Publisher:
Houghton Mifflin Harcourt