Determine whether or not distribution represent a probability distribution then explain why.
Determine whether or not distribution represent a probability distribution then explain why.

Algebra & Trigonometry with Analytic Geometry
13th Edition
ISBN:9781133382119
Author:Swokowski
Publisher:Swokowski
Chapter9: Systems Of Equations And Inequalities
Section9.9: Properties Of Determinants
Problem 46E

Related questions

Concept explainers
Contingency Table
A contingency table can be defined as the visual representation of the relationship between two or more categorical variables that can be evaluated and registered. It is a categorical version of the scatterplot, which is used to investigate the linear relationship between two variables. A contingency table is indeed a type of frequency distribution table that displays two variables at the same time.
Binomial Distribution
Binomial is an algebraic expression of the sum or the difference of two terms. Before knowing about binomial distribution, we must know about the binomial theorem.
Topic Video
Question
Determine whether or not distribution represent a
Transcribed Image Text:A Activity #5: Discrete Random Vari x
E Lyrie Anne Yuson - Activity # 5 - x
f (6) Groups | Facebook
x b Homework Help and Textbook Sc x +
A docs.google.com/document/d/12JqP6u4BtFLteU_W95Y_b8xiXOhYz3bvsv0CgFlckns/edit
S
E Apps
YouTube 9 Orchid Plant Parts a. 3 Plagarism checker
QuillBot Al e Ang Proseso ng Pa.
Search the menus (Alt+/)
A, P
100% -
Normal text
в IU A
Arial
11
+
...
1 1
3
I| 5 I 6
4
2.
P(Y)
1
4.
4
Headings you add to the document will
appear here.
2.
Y
1
3
5.
P(Y)
3.
Y
4
7
8
P(Y)
Y
1
8.
9
P(Y)
5.
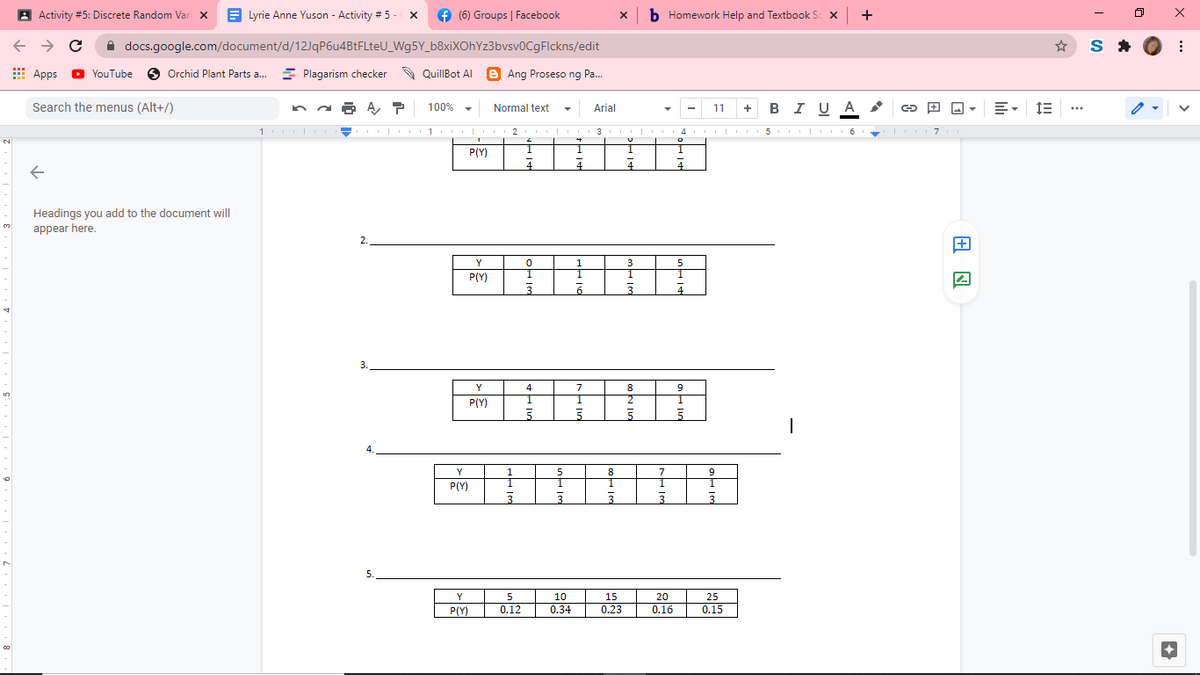
Y
5
10
15
20
25
P(Y)
0.12
0.34
0.23
0.16
0.15
Transcribed Image Text:A Activity #5: Discrete Random Vari x
A Lyrie Anne Yuson - Activity # 5 -
f (6) Groups | Facebook
x b Homework Help and Textbook Sc x +
A docs.google.com/document/d/12JqP6u4BtFLteU_W95Y_b8xiXOhYz3bvsv0CgFlckns/edit
S
E Apps
YouTube 9 Orchid Plant Parts a. 3 Plagarism checker
O
QuillBot Al e Ang Proseso ng Pa.
BI U A
Search the menus (Alt+/)
100% -
Normal text
Arial
11
...
-
| 1 | 2 I| 3 | 4 |
II II 6
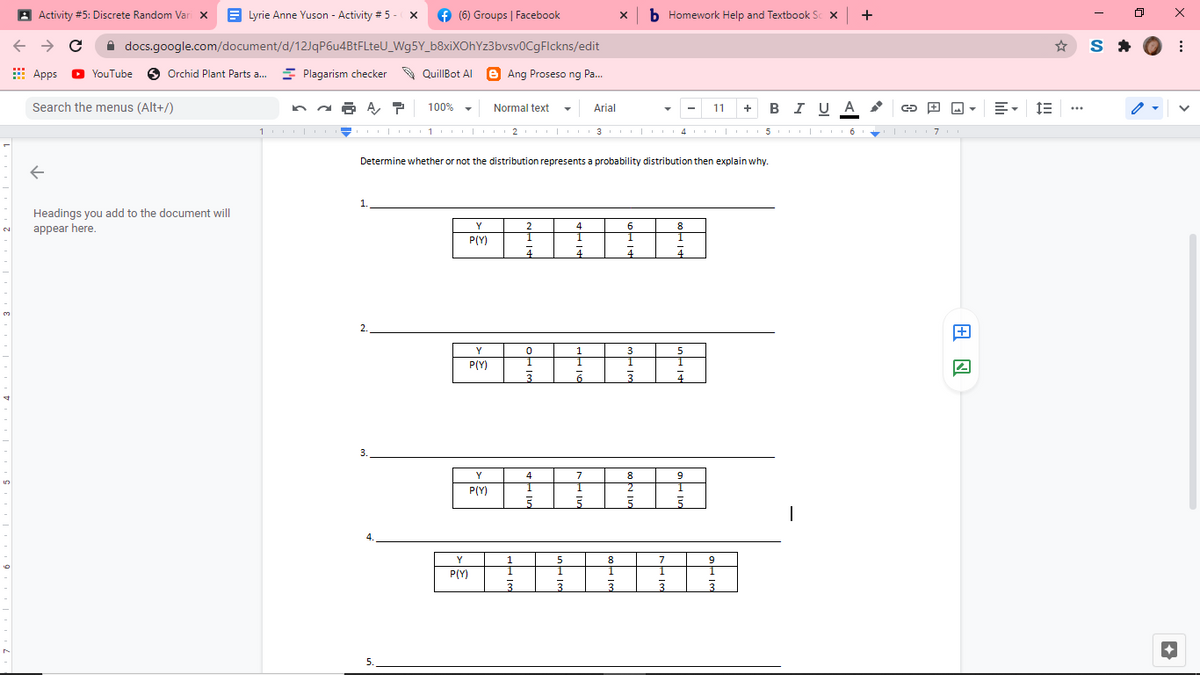
Determine whether or not the distribution represents a probability distribution then explain why.
1.
Headings you add to the document will
appear here.
Y
2
4
8.
2.
P(Y)
4
4
2.
+
Y
3
P(Y)
6
3.
Y
4
7
8
9.
P(Y)
2
5
4.
Y
1
5
8.
7
9
P(Y)
3
5.
Expert Solution
This question has been solved!
Explore an expertly crafted, step-by-step solution for a thorough understanding of key concepts.

Step by step
Solved in 2 steps

Knowledge Booster


Learn more about
Need a deep-dive on the concept behind this application? Look no further. Learn more about this topic, statistics and related others by exploring similar questions and additional content below.Recommended textbooks for you
Algebra & Trigonometry with Analytic Geometry
Algebra
ISBN:
9781133382119
Author:
Swokowski
Publisher:
Cengage
Algebra & Trigonometry with Analytic Geometry
Algebra
ISBN:
9781133382119
Author:
Swokowski
Publisher:
Cengage