Determining the Earthquake Distance You can now determine the distance from each seismic recording station to the earthquake's epicenter using the known times of travel of the S and Pwaves. 80 Examine the graph to the right, a graph of seismic wave travel times. There are three curves on the graph: The upper curve shows S wave travel-time graphed versus distance, the center one shows P wave travel time versus distance, and the lower one shows the variation distance with the difference of the S and P travel times. It takes an S wave approximately 70 seconds to travel 300 kilometers. 70 For practice, how long does it take the P wave to travel this same distance? €80 For the rest of this exercise you won't be needing the individual S and P curves, only the S-P curve. 50 To determine the epicentral distance, we need greater resolution on graph. We will use the graph below, which shows an expanded part of the S-P curve. 10 200 300 400 500 600 700 Distance (Kilometers) Determining Distance from S-P Use the S-P graph to the left and the estimates you made for the S-P time intervals for the three seismograms (shown again for your convenience) to complete the table below. The horizontal grid is in one second intervals. Then click the Find Epicenter button. Station S-P Interval Epicentral Distance Pusan 56 seconds Tokyo 44 seconds KM KM Akita 71 seconds KM Find Epicente 700 Time (Seconds) 300 500 Distance (kilometers) Time (Secon આણ 20 S-Wave
Determining the Earthquake Distance You can now determine the distance from each seismic recording station to the earthquake's epicenter using the known times of travel of the S and Pwaves. 80 Examine the graph to the right, a graph of seismic wave travel times. There are three curves on the graph: The upper curve shows S wave travel-time graphed versus distance, the center one shows P wave travel time versus distance, and the lower one shows the variation distance with the difference of the S and P travel times. It takes an S wave approximately 70 seconds to travel 300 kilometers. 70 For practice, how long does it take the P wave to travel this same distance? €80 For the rest of this exercise you won't be needing the individual S and P curves, only the S-P curve. 50 To determine the epicentral distance, we need greater resolution on graph. We will use the graph below, which shows an expanded part of the S-P curve. 10 200 300 400 500 600 700 Distance (Kilometers) Determining Distance from S-P Use the S-P graph to the left and the estimates you made for the S-P time intervals for the three seismograms (shown again for your convenience) to complete the table below. The horizontal grid is in one second intervals. Then click the Find Epicenter button. Station S-P Interval Epicentral Distance Pusan 56 seconds Tokyo 44 seconds KM KM Akita 71 seconds KM Find Epicente 700 Time (Seconds) 300 500 Distance (kilometers) Time (Secon આણ 20 S-Wave

Applications and Investigations in Earth Science (9th Edition)
9th Edition
ISBN:9780134746241
Author:Edward J. Tarbuck, Frederick K. Lutgens, Dennis G. Tasa
Publisher:Edward J. Tarbuck, Frederick K. Lutgens, Dennis G. Tasa
Chapter1: The Study Of Minerals
Section: Chapter Questions
Problem 1LR

Related questions
Question
Transcribed Image Text:Determining the Earthquake Distance
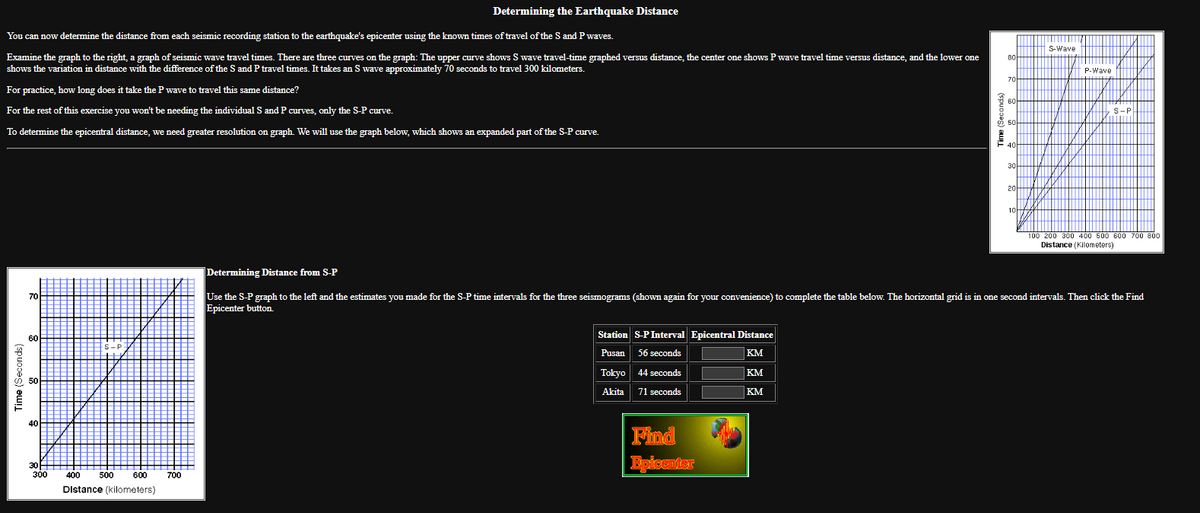
You can now determine the distance from each seismic recording station to the earthquake's epicenter using the known times of travel of the S and P waves.
80
Examine the graph to the right, a graph of seismic wave travel times. There are three curves on the graph: The upper curve shows S wave travel-time graphed versus distance, the center one shows P wave travel time versus distance, and the lower one
shows the variation in distance with the difference of the S and P travel times. It takes an S wave approximately 70 seconds to travel 300 kilometers.
P-Wave
70
For practice, how long does it take the P wave to travel this same distance?
60
For the rest of this exercise you won't be needing the individual Sand P curves, only the S-P curve.
To determine the epicentral distance, we need greater resolution on graph. We will use the graph below, which shows an expanded part of the S-P curve.
100 200 300 400 500 600 700 800
Distance (Kilometers)
Determining Distance from S-P
70
Use the S-P graph to the left and the estimates you made for the S-P time intervals for the three seismograms (shown again for your convenience) to complete the table below. The horizontal grid is in one second intervals. Then click the Find
Epicenter button.
60
Station S-P Interval Epicentral Distance
Pusan 56 seconds
KM
Tokyo 44 seconds
KM
Akita 71 seconds
KM
700
Time (Seconds)
300
400
500
600
Distance (kilometers)
Find
Epicenter
$
30
+ s-Wave
Expert Solution
This question has been solved!
Explore an expertly crafted, step-by-step solution for a thorough understanding of key concepts.

This is a popular solution!

Trending now
This is a popular solution!

Step by step
Solved in 2 steps

Recommended textbooks for you
Applications and Investigations in Earth Science …
Earth Science
ISBN:
9780134746241
Author:
Edward J. Tarbuck, Frederick K. Lutgens, Dennis G. Tasa
Publisher:
PEARSON

Exercises for Weather & Climate (9th Edition)
Earth Science
ISBN:
9780134041360
Author:
Greg Carbone
Publisher:
PEARSON

Environmental Science
Earth Science
ISBN:
9781260153125
Author:
William P Cunningham Prof., Mary Ann Cunningham Professor
Publisher:
McGraw-Hill Education
Applications and Investigations in Earth Science …
Earth Science
ISBN:
9780134746241
Author:
Edward J. Tarbuck, Frederick K. Lutgens, Dennis G. Tasa
Publisher:
PEARSON
Exercises for Weather & Climate (9th Edition)
Earth Science
ISBN:
9780134041360
Author:
Greg Carbone
Publisher:
PEARSON
Environmental Science
Earth Science
ISBN:
9781260153125
Author:
William P Cunningham Prof., Mary Ann Cunningham Professor
Publisher:
McGraw-Hill Education

Earth Science (15th Edition)
Earth Science
ISBN:
9780134543536
Author:
Edward J. Tarbuck, Frederick K. Lutgens, Dennis G. Tasa
Publisher:
PEARSON

Environmental Science (MindTap Course List)
Earth Science
ISBN:
9781337569613
Author:
G. Tyler Miller, Scott Spoolman
Publisher:
Cengage Learning

Physical Geology
Earth Science
ISBN:
9781259916823
Author:
Plummer, Charles C., CARLSON, Diane H., Hammersley, Lisa
Publisher:
Mcgraw-hill Education,