Develop X chart for the process using 35 control limits. Develop an R chart for the process using 35 control limits. What conclusions can be drawn?
Develop X chart for the process using 35 control limits. Develop an R chart for the process using 35 control limits. What conclusions can be drawn?

Practical Management Science
6th Edition
ISBN:9781337406659
Author:WINSTON, Wayne L.
Publisher:WINSTON, Wayne L.
Chapter2: Introduction To Spreadsheet Modeling
Section: Chapter Questions
Problem 20P: Julie James is opening a lemonade stand. She believes the fixed cost per week of running the stand...

Related questions
Question
Transcribed Image Text:online
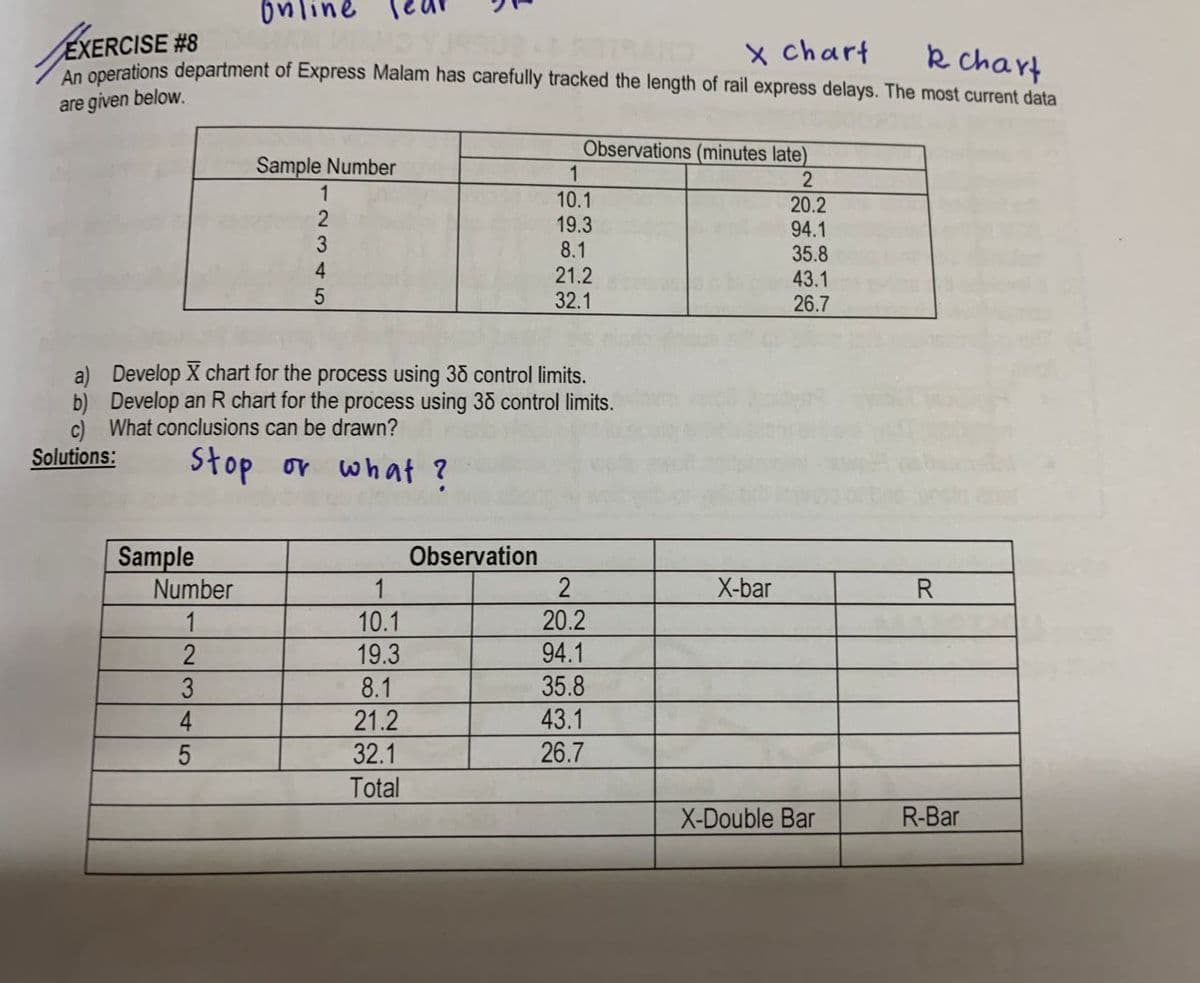
EXERCISE #8
Operations department of Express Malam has carefully tracked the length of rail express delays. The most current data
x chart
k chart
are given below.
Sample Number
Observations (minutes late)
1
2
1
10.1
19.3
8.1
21.2
32.1
20.2
94.1
35.8
43.1
26.7
3
4
a) Develop X chart for the process using 35 control limits.
b) Develop an R chart for the prrocess using 35 control limits.
c) What conclusions can be drawn?
Solutions:
Stop or what ?
Observation
Sample
Number
1
X-bar
R.
1
10.1
20.2
19.3
94.1
35.8
43.1
3
8.1
4
21.2
32.1
26.7
Total
X-Double Bar
R-Bar
Expert Solution
This question has been solved!
Explore an expertly crafted, step-by-step solution for a thorough understanding of key concepts.

Step by step
Solved in 5 steps with 2 images

Recommended textbooks for you
Practical Management Science
Operations Management
ISBN:
9781337406659
Author:
WINSTON, Wayne L.
Publisher:
Cengage,

Operations Management
Operations Management
ISBN:
9781259667473
Author:
William J Stevenson
Publisher:
McGraw-Hill Education

Operations and Supply Chain Management (Mcgraw-hi…
Operations Management
ISBN:
9781259666100
Author:
F. Robert Jacobs, Richard B Chase
Publisher:
McGraw-Hill Education
Practical Management Science
Operations Management
ISBN:
9781337406659
Author:
WINSTON, Wayne L.
Publisher:
Cengage,
Operations Management
Operations Management
ISBN:
9781259667473
Author:
William J Stevenson
Publisher:
McGraw-Hill Education
Operations and Supply Chain Management (Mcgraw-hi…
Operations Management
ISBN:
9781259666100
Author:
F. Robert Jacobs, Richard B Chase
Publisher:
McGraw-Hill Education


Purchasing and Supply Chain Management
Operations Management
ISBN:
9781285869681
Author:
Robert M. Monczka, Robert B. Handfield, Larry C. Giunipero, James L. Patterson
Publisher:
Cengage Learning

Production and Operations Analysis, Seventh Editi…
Operations Management
ISBN:
9781478623069
Author:
Steven Nahmias, Tava Lennon Olsen
Publisher:
Waveland Press, Inc.