Dian Duty Free is a are retail outlets whose goods are exempt from the payment of certain local or national taxes and duties, on the requirement that the goods sold will be sold to travelers who will take them out of the country. Which products can be sold duty-free vary by jurisdiction, as well as how they can be sold, and the process of calculating the duty or refunding the duty component. Attached the Financial ratios of Dian Duty Free in 2018 to 2019. Please analyze the Dian Duty Free Financial Ratios based on the table attached.
Dian Duty Free is a are retail outlets whose goods are exempt from the payment of certain local or national taxes and duties, on the requirement that the goods sold will be sold to travelers who will take them out of the country. Which products can be sold duty-free vary by jurisdiction, as well as how they can be sold, and the process of calculating the duty or refunding the duty component. Attached the Financial ratios of Dian Duty Free in 2018 to 2019. Please analyze the Dian Duty Free Financial Ratios based on the table attached.

Financial & Managerial Accounting
13th Edition
ISBN:9781285866307
Author:Carl Warren, James M. Reeve, Jonathan Duchac
Publisher:Carl Warren, James M. Reeve, Jonathan Duchac
Chapter15: Financial Statement Analysis
Section: Chapter Questions
Problem 15.17EX: Profitability ratios The following selected data were taken from the financial statements of...

Related questions
Question
100%
Dian Duty Free is a are retail outlets whose goods are exempt from the payment of certain local or national taxes and duties, on the requirement that the goods sold will be sold to travelers who will take them out of the country. Which products can be sold duty-free vary by jurisdiction, as well as how they can be sold, and the process of calculating the duty or refunding the duty component.
Attached the Financial ratios of Dian Duty Free in 2018 to 2019.
Please analyze the Dian Duty Free Financial Ratios based on the table attached.
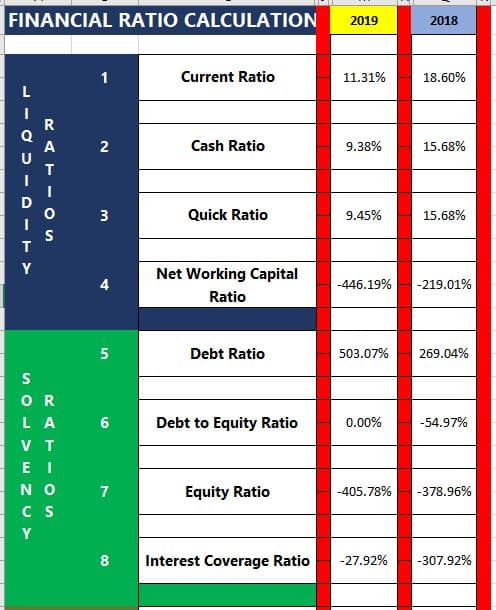
Transcribed Image Text:FINANCIAL RATIO CALCULATION
2019
2018
1
Current Ratio
11.31%
18.60%
L
Cash Ratio
A
U
2
9.38%
15.68%
3
Quick Ratio
9.45%
15.68%
Net Working Capital
-446.19%
-219.01%
Ratio
5
Debt Ratio
503.07%
269.04%
OR
LA
6
Debt to Equity Ratio
0.00%
-54.97%
V T
E I
NO
7
Equity Ratio
-405.78%
-378.96%
C S
Y
8
Interest Coverage Ratio
-27.92%
-307.92%
- D - TY
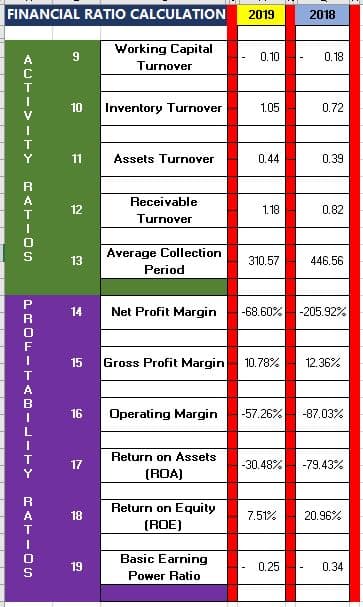
Transcribed Image Text:FINANCIAL RATIO CALCULATION
2019
2018
Working Capital
9
0.10
0.18
-
Turnover
10
Inventory Turnover
1.05
0.72
Y
11
Assets Turnover
0.44
0.39
R
Receivable
12
1.18
0.82
T
Turnover
Average Collection
Period
13
310.57
446.56
14
Net Profit Margin
-68.60%
-205.92%
15
Gross Profit Margin
10.78%
12.36%
16
Operating Margin
-57.26%
-87.03%
Return on Assets
17
-30.48%
-79.43%
(ROA)
Return on Equity
A
18
7.51%
20.96%
(ROE)
Basic Earning
19
0.25
0.34
Роwег Ratio
LROF-TABILITY
Expert Solution
This question has been solved!
Explore an expertly crafted, step-by-step solution for a thorough understanding of key concepts.

Step by step
Solved in 2 steps

Knowledge Booster


Learn more about
Need a deep-dive on the concept behind this application? Look no further. Learn more about this topic, finance and related others by exploring similar questions and additional content below.Recommended textbooks for you
Financial & Managerial Accounting
Accounting
ISBN:
9781285866307
Author:
Carl Warren, James M. Reeve, Jonathan Duchac
Publisher:
Cengage Learning
Financial & Managerial Accounting
Accounting
ISBN:
9781285866307
Author:
Carl Warren, James M. Reeve, Jonathan Duchac
Publisher:
Cengage Learning