Direction: Complete the table below by constructing and probability distribution of Example 3 (refer to page 7. Solution Steps 1. List the sample space 2. Count the number of tails in each outcome and assign this number to this outcome. 3. Construct the frequency distribution of the values of the given random variable. 4. Construct the probability distribution of the given random variable by getting the probability of occurrence of each value of the random variable. 5. Construct the probability histogram.
Direction: Complete the table below by constructing and probability distribution of Example 3 (refer to page 7. Solution Steps 1. List the sample space 2. Count the number of tails in each outcome and assign this number to this outcome. 3. Construct the frequency distribution of the values of the given random variable. 4. Construct the probability distribution of the given random variable by getting the probability of occurrence of each value of the random variable. 5. Construct the probability histogram.

Holt Mcdougal Larson Pre-algebra: Student Edition 2012
1st Edition
ISBN:9780547587776
Author:HOLT MCDOUGAL
Publisher:HOLT MCDOUGAL
Chapter11: Data Analysis And Probability
Section: Chapter Questions
Problem 8CR

Related questions
Question
Please provide a clear and understandable solutions
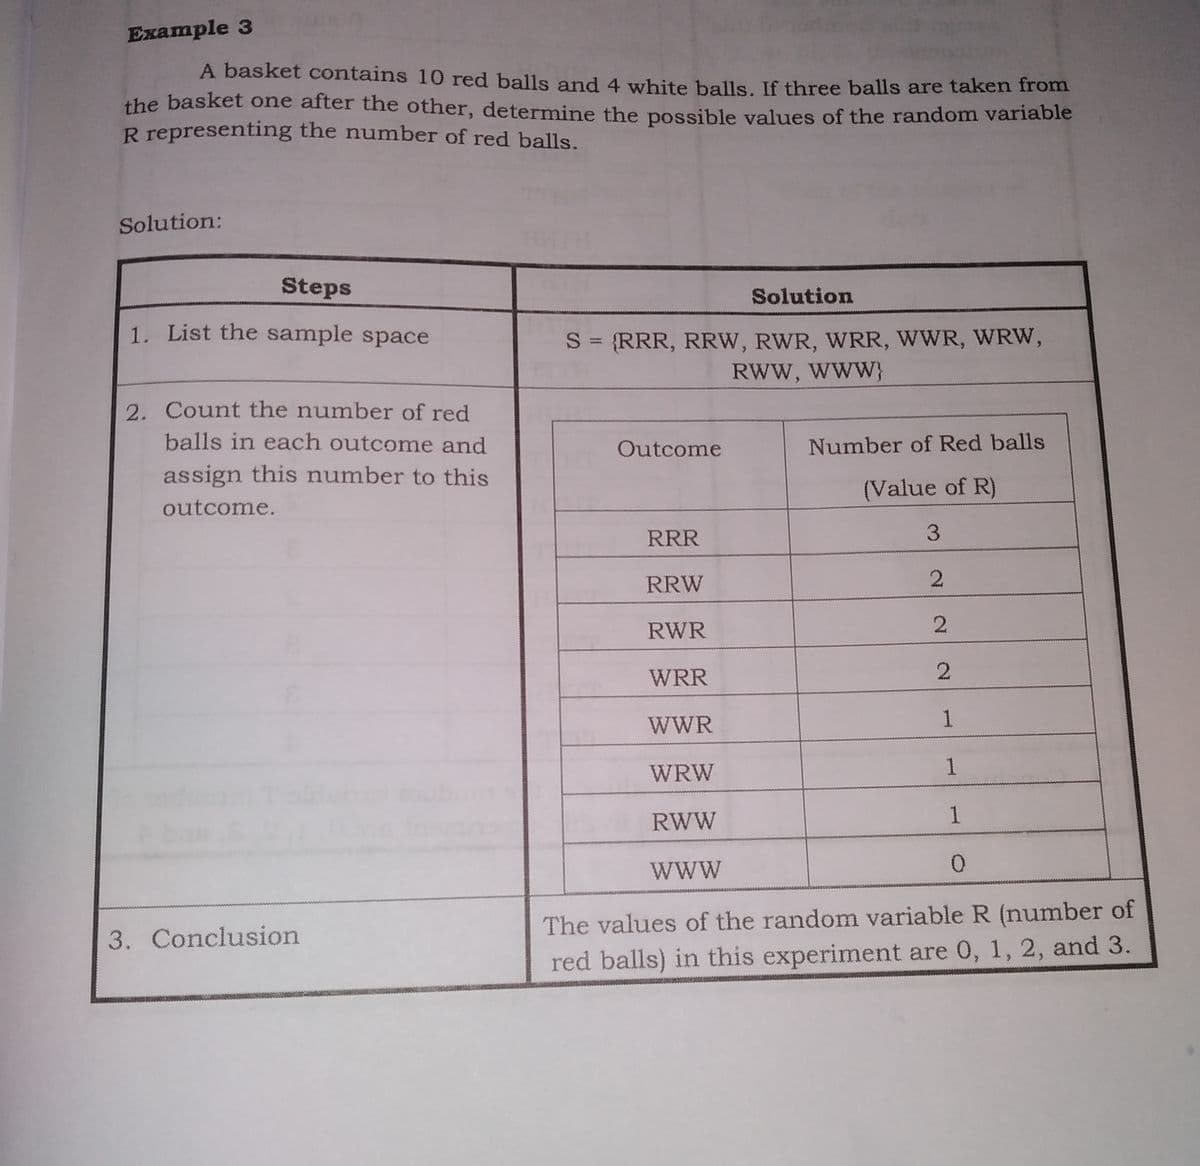
Transcribed Image Text:Example 3
A basket contains 10 red balls and 4 white balls. If three balls are taken from
the basket one after the other, determine the possible values of the random variable
R representing the number of red balls.
Solution:
Steps
Solution
1. List the sample space
S = {RRR, RRWW, RWR, WRR, WWR, WRW,
RWW, WwW}
2. Count the number of red
balls in each outcome and
Outcome
Number of Red balls
assign this number to this
(Value of R)
outcome.
RRR
3.
RRW
RWR
WRR
WWR
1
WRW
1
RWW
1
www
The values of the random variable R (number of
3. Conclusion
red balls) in this experiment are 0, 1, 2, and 3.
2.
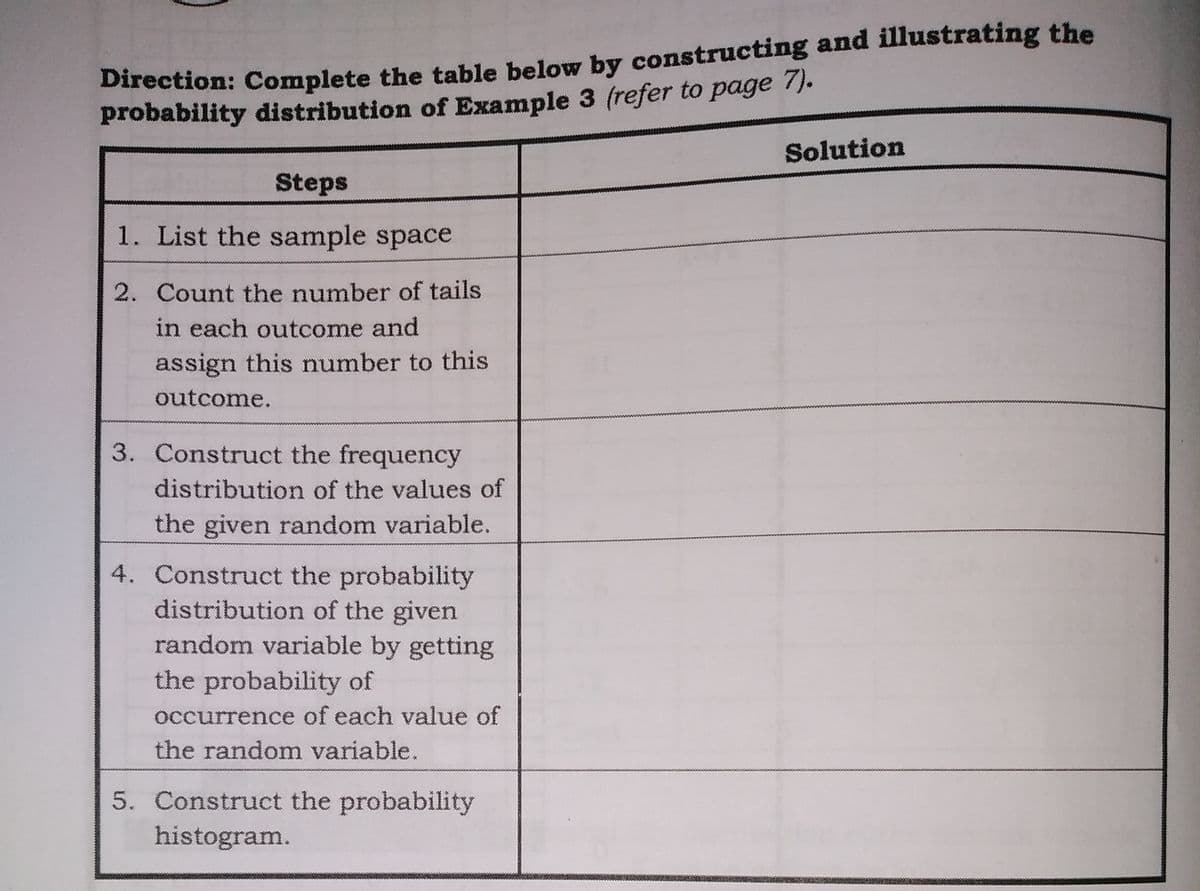
Transcribed Image Text:Direction: Complete the table below by constructing and illustrating the
probability distribution of Example 3 (refer to page 7).
Solution
Steps
1. List the sample space
2. Count the number of tails
in each outcome and
assign this number to this
outcome.
3. Construct the frequency
distribution of the values of
the given random variable.
4. Construct the probability
distribution of the given
random variable by getting
the probability of
occurrence of each value of
the random variable.
5. Construct the probability
histogram.
Expert Solution
This question has been solved!
Explore an expertly crafted, step-by-step solution for a thorough understanding of key concepts.

This is a popular solution!

Trending now
This is a popular solution!

Step by step
Solved in 2 steps with 2 images

Recommended textbooks for you
Holt Mcdougal Larson Pre-algebra: Student Edition…
Algebra
ISBN:
9780547587776
Author:
HOLT MCDOUGAL
Publisher:
HOLT MCDOUGAL


College Algebra (MindTap Course List)
Algebra
ISBN:
9781305652231
Author:
R. David Gustafson, Jeff Hughes
Publisher:
Cengage Learning
Holt Mcdougal Larson Pre-algebra: Student Edition…
Algebra
ISBN:
9780547587776
Author:
HOLT MCDOUGAL
Publisher:
HOLT MCDOUGAL
College Algebra (MindTap Course List)
Algebra
ISBN:
9781305652231
Author:
R. David Gustafson, Jeff Hughes
Publisher:
Cengage Learning