Directions: Figure 3 illustrates seismograms from the same earthquake recorded at Los Angeles, CA, St. Louis, MO and Houston, TX. Use this information to answer the following questions. Use the travel-time graph, Figure 2, to determine the distance that each station in Figure 3 is from the epicenter. Write your answers in the epicenter data table, Table 1. 1.
Directions: Figure 3 illustrates seismograms from the same earthquake recorded at Los Angeles, CA, St. Louis, MO and Houston, TX. Use this information to answer the following questions. Use the travel-time graph, Figure 2, to determine the distance that each station in Figure 3 is from the epicenter. Write your answers in the epicenter data table, Table 1. 1.

Applications and Investigations in Earth Science (9th Edition)
9th Edition
ISBN:9780134746241
Author:Edward J. Tarbuck, Frederick K. Lutgens, Dennis G. Tasa
Publisher:Edward J. Tarbuck, Frederick K. Lutgens, Dennis G. Tasa
Chapter1: The Study Of Minerals
Section: Chapter Questions
Problem 1LR

Related questions
Question
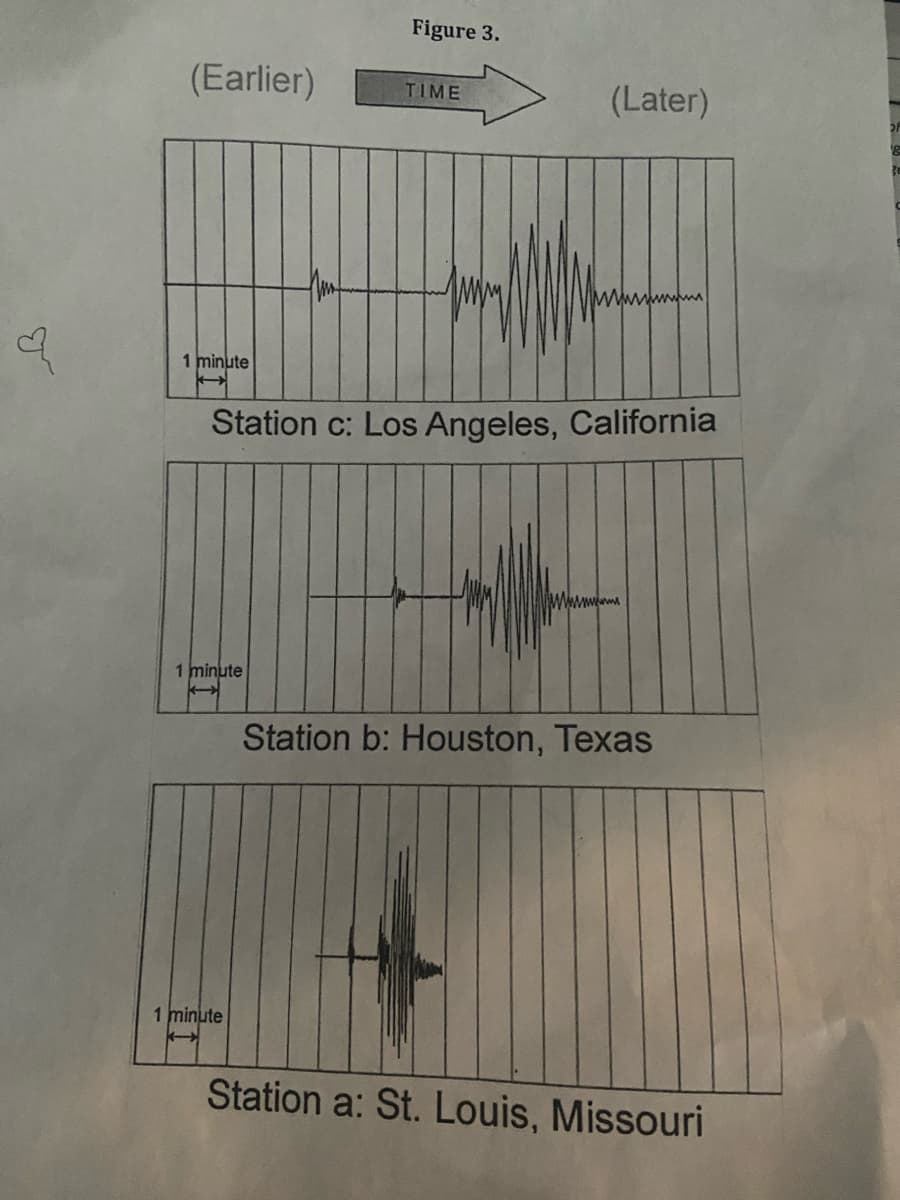
Transcribed Image Text:Figure 3.
(Earlier)
(Later)
TIME
1 minute
Station c: Los Angeles, California
Wwwww
1 minute
Station b: Houston, Texas
1 minute
Station a: St. Louis, Missouri
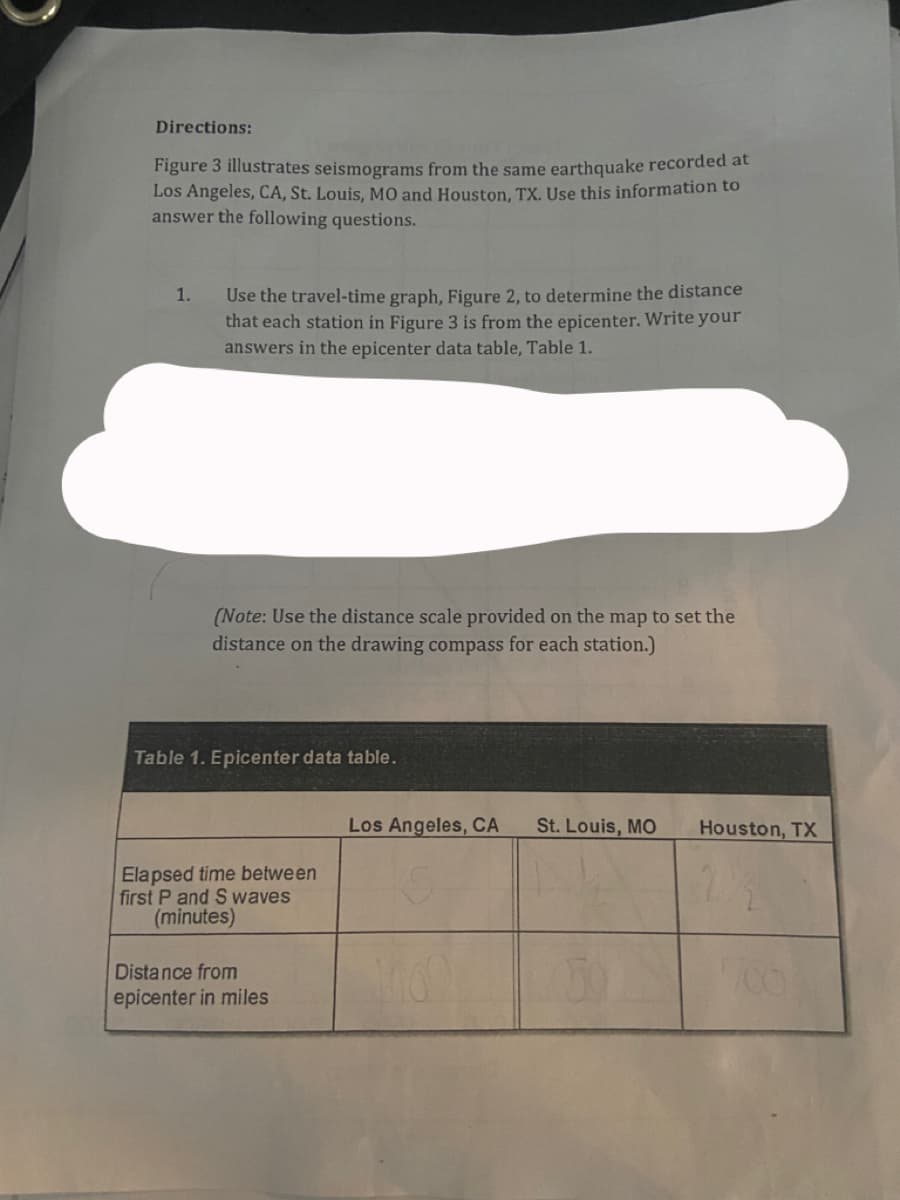
Transcribed Image Text:Directions:
Figure 3 illustrates seismograms from the same earthquake recorded at
Los Angeles, CA, St. Louis, MO and Houston, TX. Use this information to
answer the following questions.
Use the travel-time graph, Figure 2, to determine the distance
that each station in Figure 3 is from the epicenter. Write your
1.
answers in the epicenter data table, Table 1.
(Note: Use the distance scale provided on the map to set the
distance on the drawing compass for each station.)
Table 1. Epicenter data table.
Los Angeles, CA
St. Louis, MO
Houston, TX
Elapsed time between
first P and S waves
(minutes)
Distance from
epicenter in miles
Expert Solution
This question has been solved!
Explore an expertly crafted, step-by-step solution for a thorough understanding of key concepts.

This is a popular solution!

Trending now
This is a popular solution!

Step by step
Solved in 2 steps

Recommended textbooks for you
Applications and Investigations in Earth Science …
Earth Science
ISBN:
9780134746241
Author:
Edward J. Tarbuck, Frederick K. Lutgens, Dennis G. Tasa
Publisher:
PEARSON

Exercises for Weather & Climate (9th Edition)
Earth Science
ISBN:
9780134041360
Author:
Greg Carbone
Publisher:
PEARSON

Environmental Science
Earth Science
ISBN:
9781260153125
Author:
William P Cunningham Prof., Mary Ann Cunningham Professor
Publisher:
McGraw-Hill Education
Applications and Investigations in Earth Science …
Earth Science
ISBN:
9780134746241
Author:
Edward J. Tarbuck, Frederick K. Lutgens, Dennis G. Tasa
Publisher:
PEARSON
Exercises for Weather & Climate (9th Edition)
Earth Science
ISBN:
9780134041360
Author:
Greg Carbone
Publisher:
PEARSON
Environmental Science
Earth Science
ISBN:
9781260153125
Author:
William P Cunningham Prof., Mary Ann Cunningham Professor
Publisher:
McGraw-Hill Education

Earth Science (15th Edition)
Earth Science
ISBN:
9780134543536
Author:
Edward J. Tarbuck, Frederick K. Lutgens, Dennis G. Tasa
Publisher:
PEARSON

Environmental Science (MindTap Course List)
Earth Science
ISBN:
9781337569613
Author:
G. Tyler Miller, Scott Spoolman
Publisher:
Cengage Learning

Physical Geology
Earth Science
ISBN:
9781259916823
Author:
Plummer, Charles C., CARLSON, Diane H., Hammersley, Lisa
Publisher:
Mcgraw-hill Education,