Disease Control to determine heal ge students, college students were wear a seat belt when riding in a e?" The frequencies were as follow Response Never Rarely Sometimes Most of the time Always Frequen 125 324 552 1257 2518 ct a relative frequency distribution rcentage of respondents answered =rcentage of respondents answered ""? ct a frequency bar graph. ct a relative frequency bar graph. ct a pie chart. = that a representative from the Ce Control says, "52.7% of college stu wear a seat belt." Is this a descripti nt?
Disease Control to determine heal ge students, college students were wear a seat belt when riding in a e?" The frequencies were as follow Response Never Rarely Sometimes Most of the time Always Frequen 125 324 552 1257 2518 ct a relative frequency distribution rcentage of respondents answered =rcentage of respondents answered ""? ct a frequency bar graph. ct a relative frequency bar graph. ct a pie chart. = that a representative from the Ce Control says, "52.7% of college stu wear a seat belt." Is this a descripti nt?

Glencoe Algebra 1, Student Edition, 9780079039897, 0079039898, 2018
18th Edition
ISBN:9780079039897
Author:Carter
Publisher:Carter
Chapter10: Statistics
Section10.6: Summarizing Categorical Data
Problem 35PPS

Related questions
Question
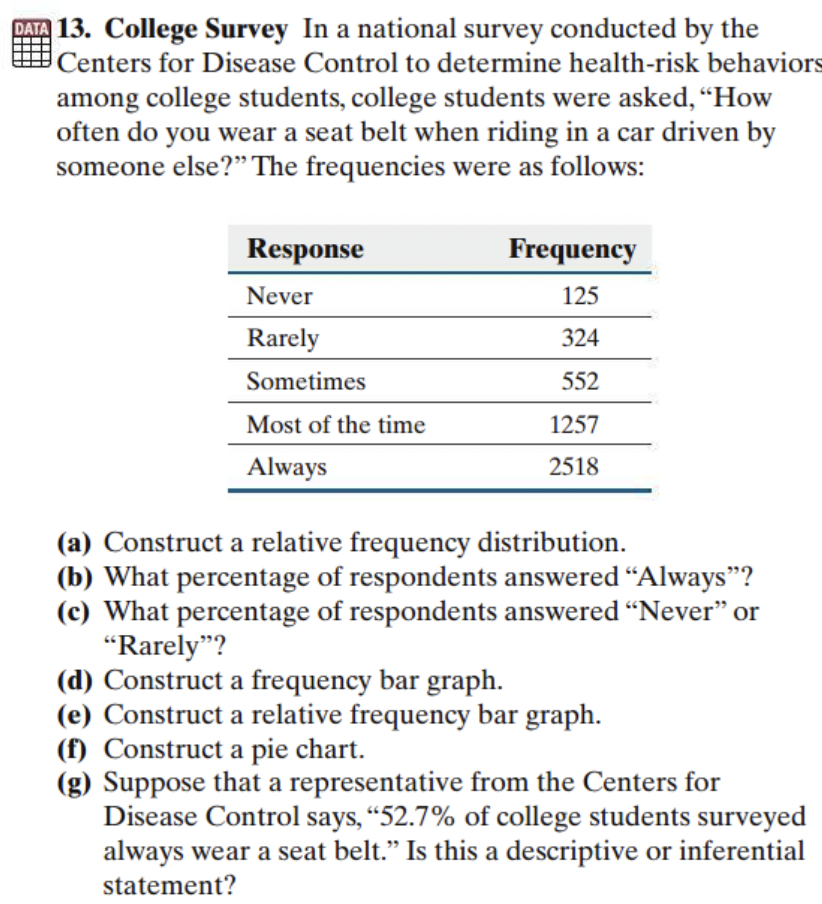
Transcribed Image Text:DATA 13. College Survey In a national survey conducted by the
Centers for Disease Control to determine health-risk behaviors
among college students, college students were asked, "How
often do you wear a seat belt when riding in a car driven by
someone else?" The frequencies were as follows:
Response
Never
Rarely
Sometimes
Most of the time
Always
Frequency
125
324
552
1257
2518
(a) Construct a relative frequency distribution.
(b) What percentage of respondents answered "Always"?
(c) What percentage of respondents answered "Never" or
"Rarely"?
(d) Construct a frequency bar graph.
(e) Construct a relative frequency bar graph.
(f) Construct a pie chart.
(g) Suppose that a representative from the Centers for
Disease Control says, "52.7% of college students surveyed
always wear a seat belt." Is this a descriptive or inferential
statement?
Expert Solution
This question has been solved!
Explore an expertly crafted, step-by-step solution for a thorough understanding of key concepts.

This is a popular solution!

Trending now
This is a popular solution!

Step by step
Solved in 2 steps with 1 images

Follow-up Questions
Read through expert solutions to related follow-up questions below.
Recommended textbooks for you
Glencoe Algebra 1, Student Edition, 9780079039897…
Algebra
ISBN:
9780079039897
Author:
Carter
Publisher:
McGraw Hill

Algebra & Trigonometry with Analytic Geometry
Algebra
ISBN:
9781133382119
Author:
Swokowski
Publisher:
Cengage

Big Ideas Math A Bridge To Success Algebra 1: Stu…
Algebra
ISBN:
9781680331141
Author:
HOUGHTON MIFFLIN HARCOURT
Publisher:
Houghton Mifflin Harcourt
Glencoe Algebra 1, Student Edition, 9780079039897…
Algebra
ISBN:
9780079039897
Author:
Carter
Publisher:
McGraw Hill
Algebra & Trigonometry with Analytic Geometry
Algebra
ISBN:
9781133382119
Author:
Swokowski
Publisher:
Cengage
Big Ideas Math A Bridge To Success Algebra 1: Stu…
Algebra
ISBN:
9781680331141
Author:
HOUGHTON MIFFLIN HARCOURT
Publisher:
Houghton Mifflin Harcourt