Distribution Center (S/bushel) Farm 5. Ohio 6. Missouri 7. lowa Supply (bushels) 1. Colorado $- $1.09 1.32 1.22 $1.26 1,600 1,100 1,400 1,900 2. Minnesota 0.89 1.17 3. North Dakota 0.78 1.36 4. Wisconsin 1.19 1.25 1.42 Processing Capacity (bushels) 1,800 2,200 1,600 Plant ($/bushel) Distributlon Center 8. Virginia 9. Pennsylvania 10. Georgia 11. Texas 5. Ohio $4.56 3.43 $3.98 5.74 $4.94 6. Missouri 4.65 5.01 7. Iowa 5.39 6.35 5.70 4.87 Demand (bushels) 1,200 900 1,100 1,500


Critical Path Method
The critical path is the longest succession of tasks that has to be successfully completed to conclude a project entirely. The tasks involved in the sequence are called critical activities, as any task getting delayed will result in the whole project getting delayed. To determine the time duration of a project, the critical path has to be identified. The critical path method or CPM is used by project managers to evaluate the least amount of time required to finish each task with the least amount of delay.
Cost Analysis
The entire idea of cost of production or definition of production cost is applied corresponding or we can say that it is related to investment or money cost. Money cost or investment refers to any money expenditure which the firm or supplier or producer undertakes in purchasing or hiring factor of production or factor services.
Inventory Management
Inventory management is the process or system of handling all the goods that an organization owns. In simpler terms, inventory management deals with how a company orders, stores, and uses its goods.
Project Management
Project Management is all about management and optimum utilization of the resources in the best possible manner to develop the software as per the requirement of the client. Here the Project refers to the development of software to meet the end objective of the client by providing the required product or service within a specified Period of time and ensuring high quality. This can be done by managing all the available resources. In short, it can be defined as an application of knowledge, skills, tools, and techniques to meet the objective of the Project. It is the duty of a Project Manager to achieve the objective of the Project as per the specifications given by the client.
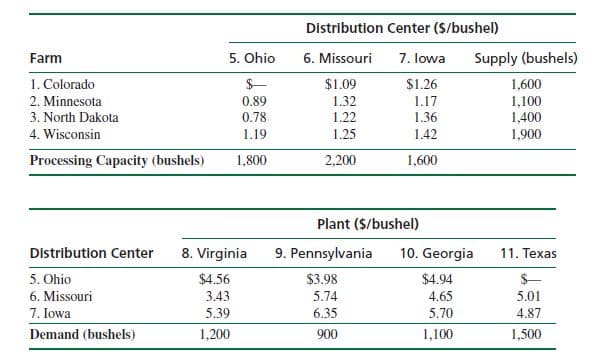
The Midlands Field Produce Company contracts with potato farmers in Colorado, Minnesota,
North Dakota, and Wisconsin for monthly potato shipments. Midlands picks up the potatoes at
the farms and ships mostly by truck (and sometimes by rail) to its sorting and distribution centers
in Ohio, Missouri, and Iowa. At these centers the potatoes are cleaned, rejects are discarded, and
the potatoes are sorted according to size and quality. They are then shipped to combination plants
and distribution centers in Virginia, Pennsylvania, Georgia, and Texas, where the company produces
a variety of potato products and distributes bags of potatoes to stores. Exceptions are the
Ohio distribution center, which will accept potatoes only from farms in Minnesota, North Dakota,
and Wisconsin, and the Texas plant, which won’t accept shipments from Ohio because of disagreements
over delivery
costs from the farms to the distribution centers and the processing and shipping costs from the
distribution centers to the plants, as well as the available monthly supply at each farm, the processing
capacity at the distribution centers, and the final demand at the plants (in bushels): Formulate and solve a linear programming model to determine the optimal monthly shipments
from the farms to the distribution centers and from the distribution centers to the plants to minimize
total shipping and


Trending now
This is a popular solution!

Step by step
Solved in 2 steps


