D'LEON INC., PART Il FINANCIAL STATEMENTS AND TAXES Part I of this case, presented in Chapter 3, discussed the situation of D'Leon Inc., a regional snack foods producer, after an expansion program. D'Leon had increased plant capacity and undertaken a major marketing campaign in an attempt to "go national." Thus far, sales have not been up to the forecasted level, costs have been higher than were projected, and a large loss occurred in 2018 rather than the expected profit. As a result, its managers, directors, and investors are concerned about the firm's survival Donna Jamison was brought in as assistant to Fred Campo, D'Leon's chairman, who had the task of getting the company back into a sound financial position. D'Leon's 2017 and 2018 balance sheets and income statements, together with projections for 2019, are given in Tables IC 4.1 and IC 4.2. In addition, Table IC 4.3 gives the company's 2017 and 2018 financial ratios, together with industry average data. The 2019 projected financial statement data represent Jamison's and Campo's best guess for 2019 results, assuming that some new financing is arranged to get the company "over the hump. Jamison examined monthly data for 2018 (not given in the case), and she detected an improving pattern during the year. Monthly sales were rising, costs were falling, and large losses in the early months had turned to a small profit by December. Thus, the annual data look somewhat worse than final monthly data. Also, it appears to be taking longer for the advertising program to get the message out, for the new sales offices to generate sales, and for the new manufacturing facilities to operate efficiently. In other words, the lags between spending money and deriving benefits were longer than D'Leon's managers had anticipated. For these reasons, Jamison and Campo see hope for the company-provided it can survive in the short run Jamison must prepare an analysis of where the company is now, what it must do to regain its financial health, and what actions should be taken. Your assignment is to help her answer the following questions Provide clear explanations, not yes or no answers: G. Use the DuPont equation to provide a summary and overview of D'Leon's financial condition as projected for 2019. What are the firm's major strengths and weaknesses? - DuPont equation is ROE= ROA X Equity Multiplier =Profit margin x Total assets turnover x Equity Multiplier =Net Income/ Sales x Sales/Total Assets x Total Assets / Total Common Equity H. Use the following simplified 2019 balance sheet to show, in general terms, how an improvement in the DSO would tend to affect the stock price. For example, if the company could improve its collection procedures and thereby lower its DSO from 45.6 days to the 32-day industry average without affecting sales, how would that change "ripple through" the financial statements (shown in thousands below) and influence the stock price? Accounts receivable: $878 Other Current Assets: 1,802 Net Fixed Assets: 817 Total Assets: $3,497 Current Liabilities: $845 Debt: 700 Equity: 1,952 Liabilities Plus Equity: $3,497
D'LEON INC., PART Il FINANCIAL STATEMENTS AND TAXES Part I of this case, presented in Chapter 3, discussed the situation of D'Leon Inc., a regional snack foods producer, after an expansion program. D'Leon had increased plant capacity and undertaken a major marketing campaign in an attempt to "go national." Thus far, sales have not been up to the forecasted level, costs have been higher than were projected, and a large loss occurred in 2018 rather than the expected profit. As a result, its managers, directors, and investors are concerned about the firm's survival Donna Jamison was brought in as assistant to Fred Campo, D'Leon's chairman, who had the task of getting the company back into a sound financial position. D'Leon's 2017 and 2018 balance sheets and income statements, together with projections for 2019, are given in Tables IC 4.1 and IC 4.2. In addition, Table IC 4.3 gives the company's 2017 and 2018 financial ratios, together with industry average data. The 2019 projected financial statement data represent Jamison's and Campo's best guess for 2019 results, assuming that some new financing is arranged to get the company "over the hump. Jamison examined monthly data for 2018 (not given in the case), and she detected an improving pattern during the year. Monthly sales were rising, costs were falling, and large losses in the early months had turned to a small profit by December. Thus, the annual data look somewhat worse than final monthly data. Also, it appears to be taking longer for the advertising program to get the message out, for the new sales offices to generate sales, and for the new manufacturing facilities to operate efficiently. In other words, the lags between spending money and deriving benefits were longer than D'Leon's managers had anticipated. For these reasons, Jamison and Campo see hope for the company-provided it can survive in the short run Jamison must prepare an analysis of where the company is now, what it must do to regain its financial health, and what actions should be taken. Your assignment is to help her answer the following questions Provide clear explanations, not yes or no answers: G. Use the DuPont equation to provide a summary and overview of D'Leon's financial condition as projected for 2019. What are the firm's major strengths and weaknesses? - DuPont equation is ROE= ROA X Equity Multiplier =Profit margin x Total assets turnover x Equity Multiplier =Net Income/ Sales x Sales/Total Assets x Total Assets / Total Common Equity H. Use the following simplified 2019 balance sheet to show, in general terms, how an improvement in the DSO would tend to affect the stock price. For example, if the company could improve its collection procedures and thereby lower its DSO from 45.6 days to the 32-day industry average without affecting sales, how would that change "ripple through" the financial statements (shown in thousands below) and influence the stock price? Accounts receivable: $878 Other Current Assets: 1,802 Net Fixed Assets: 817 Total Assets: $3,497 Current Liabilities: $845 Debt: 700 Equity: 1,952 Liabilities Plus Equity: $3,497

Essentials Of Investments
11th Edition
ISBN:9781260013924
Author:Bodie, Zvi, Kane, Alex, MARCUS, Alan J.
Publisher:Bodie, Zvi, Kane, Alex, MARCUS, Alan J.
Chapter1: Investments: Background And Issues
Section: Chapter Questions
Problem 1PS

Related questions
Question
D'LEON INC., PART Il
FINANCIAL STATEMENTS AND TAXES Part I of this case, presented in Chapter 3, discussed the situation of
D'Leon Inc., a regional snack foods producer, after an expansion program. D'Leon had increased plant capacity
and undertaken a major marketing campaign in an attempt to "go national." Thus far, sales have not been up
to the forecasted level, costs have been higher than were projected, and a large loss occurred in 2018 rather than
the expected profit. As a result, its managers, directors, and investors are concerned about the firm's survival
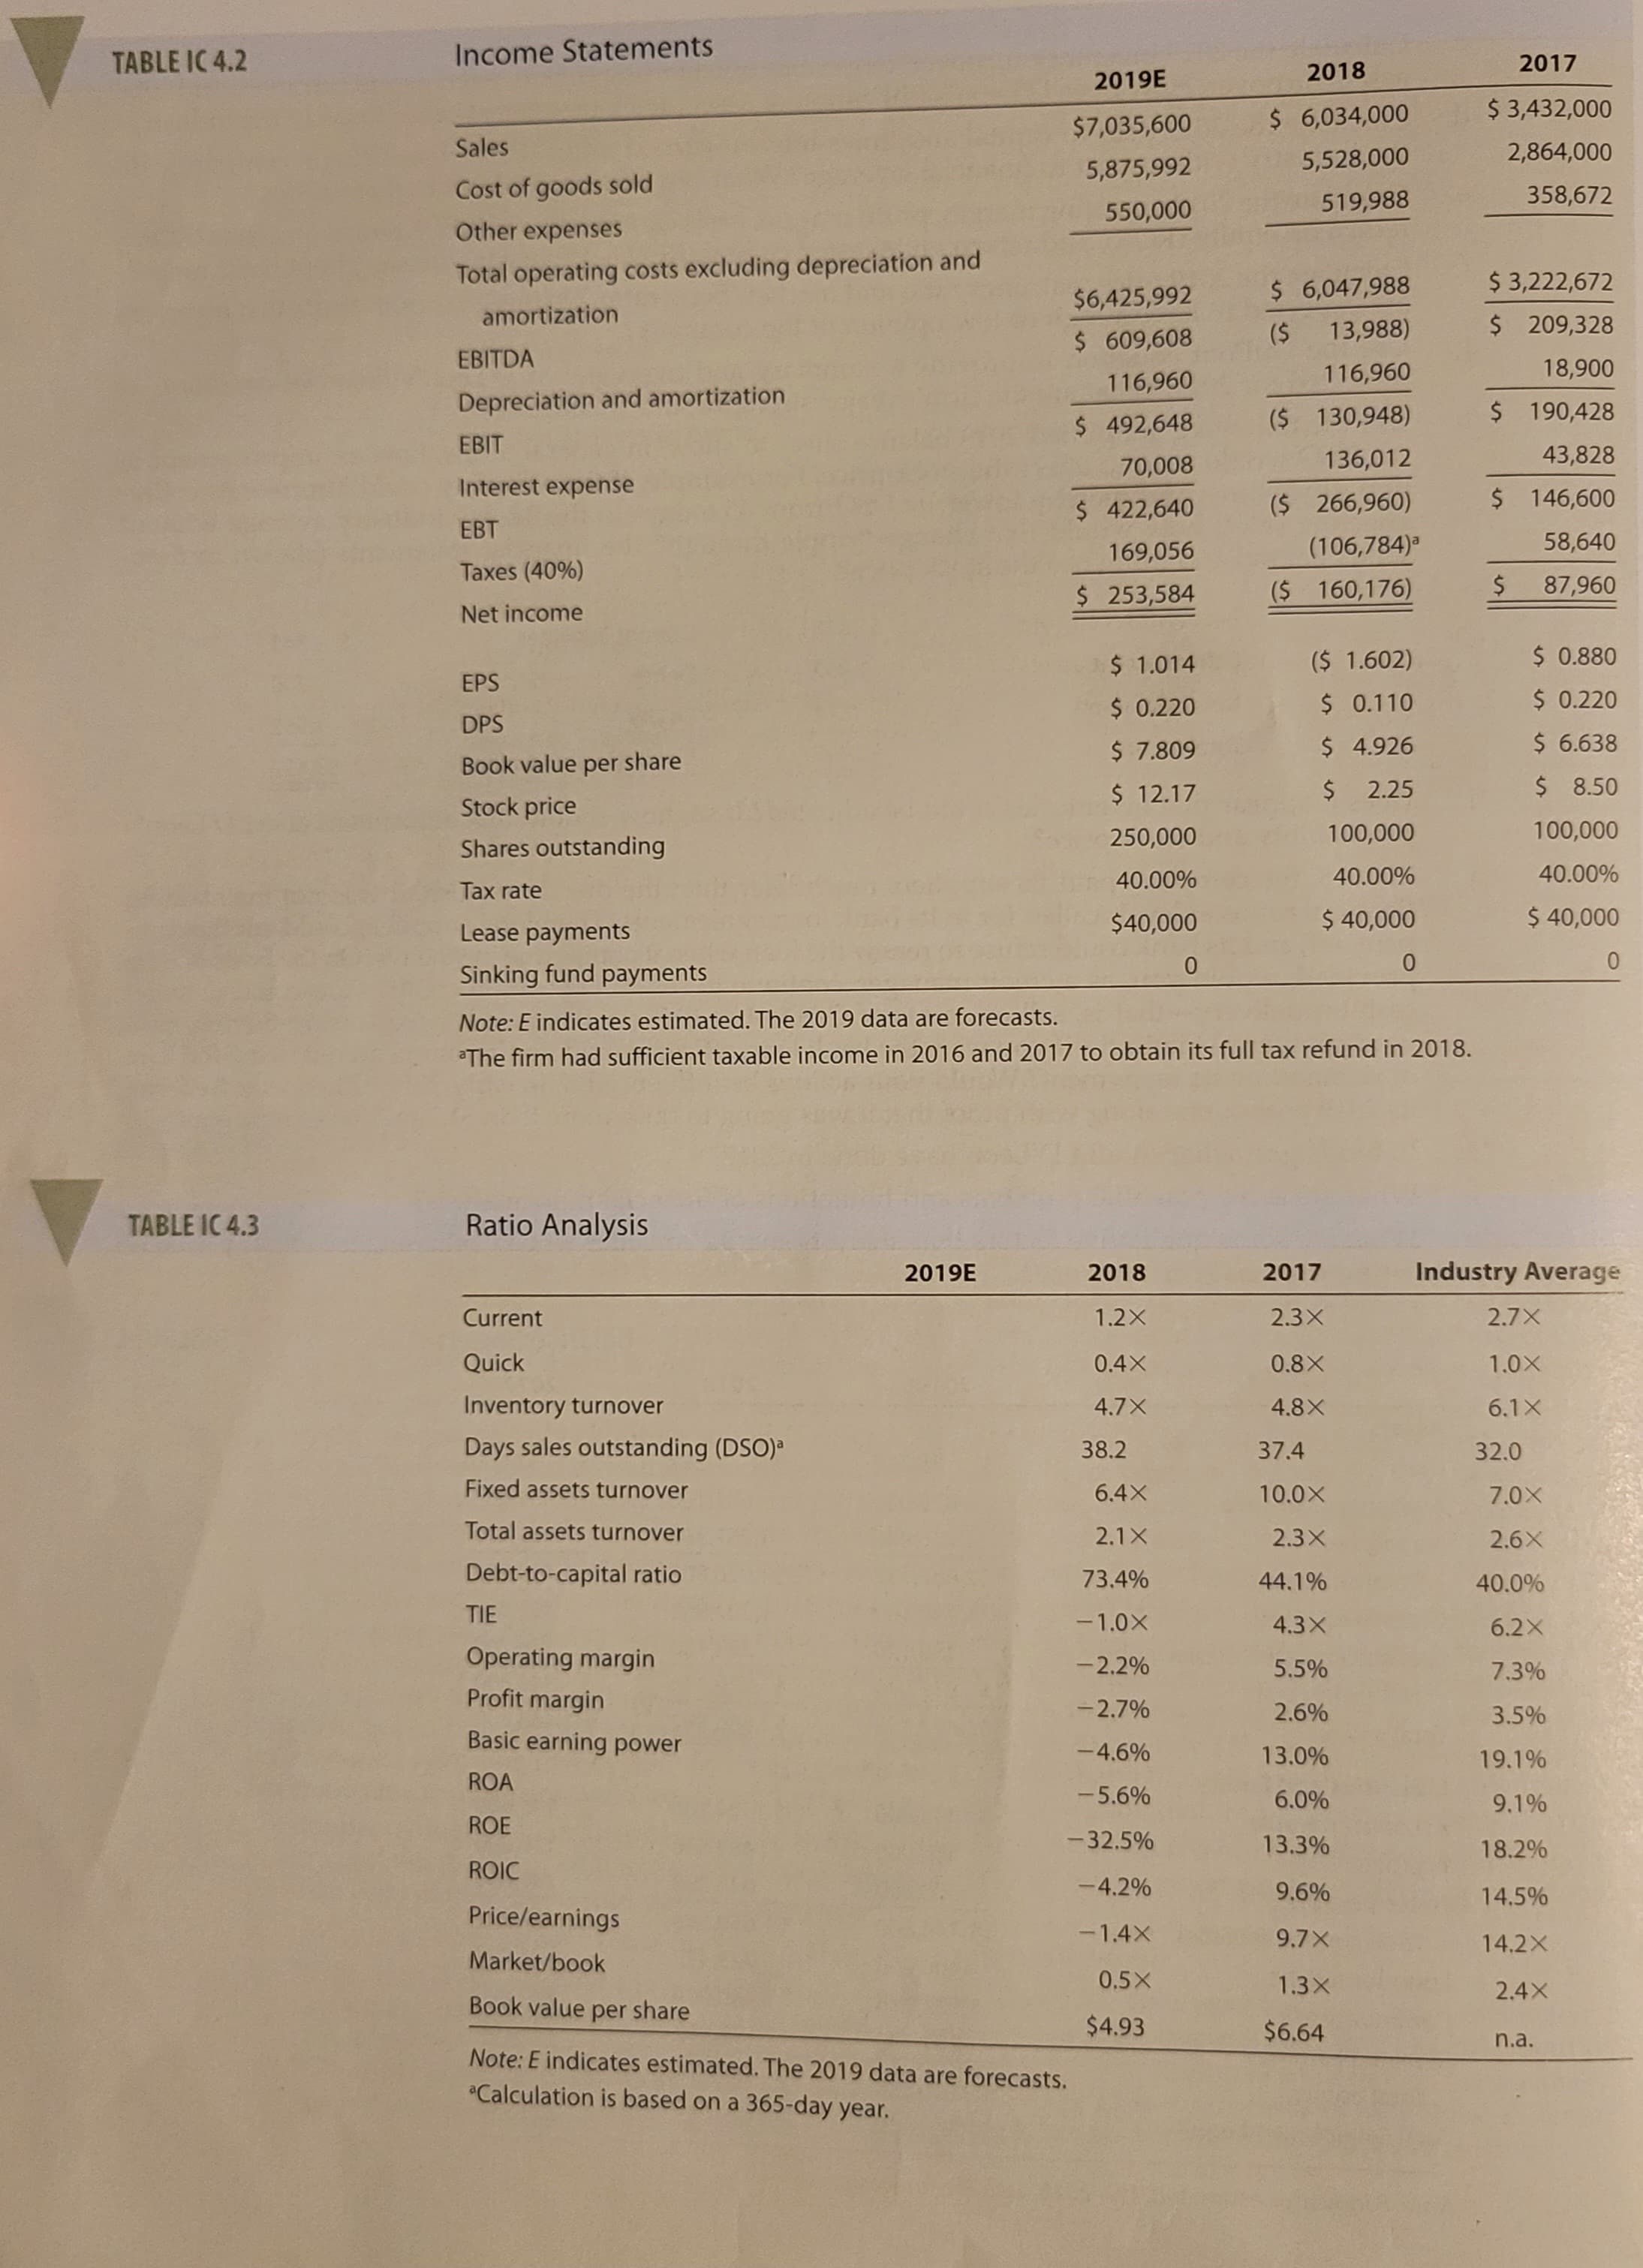
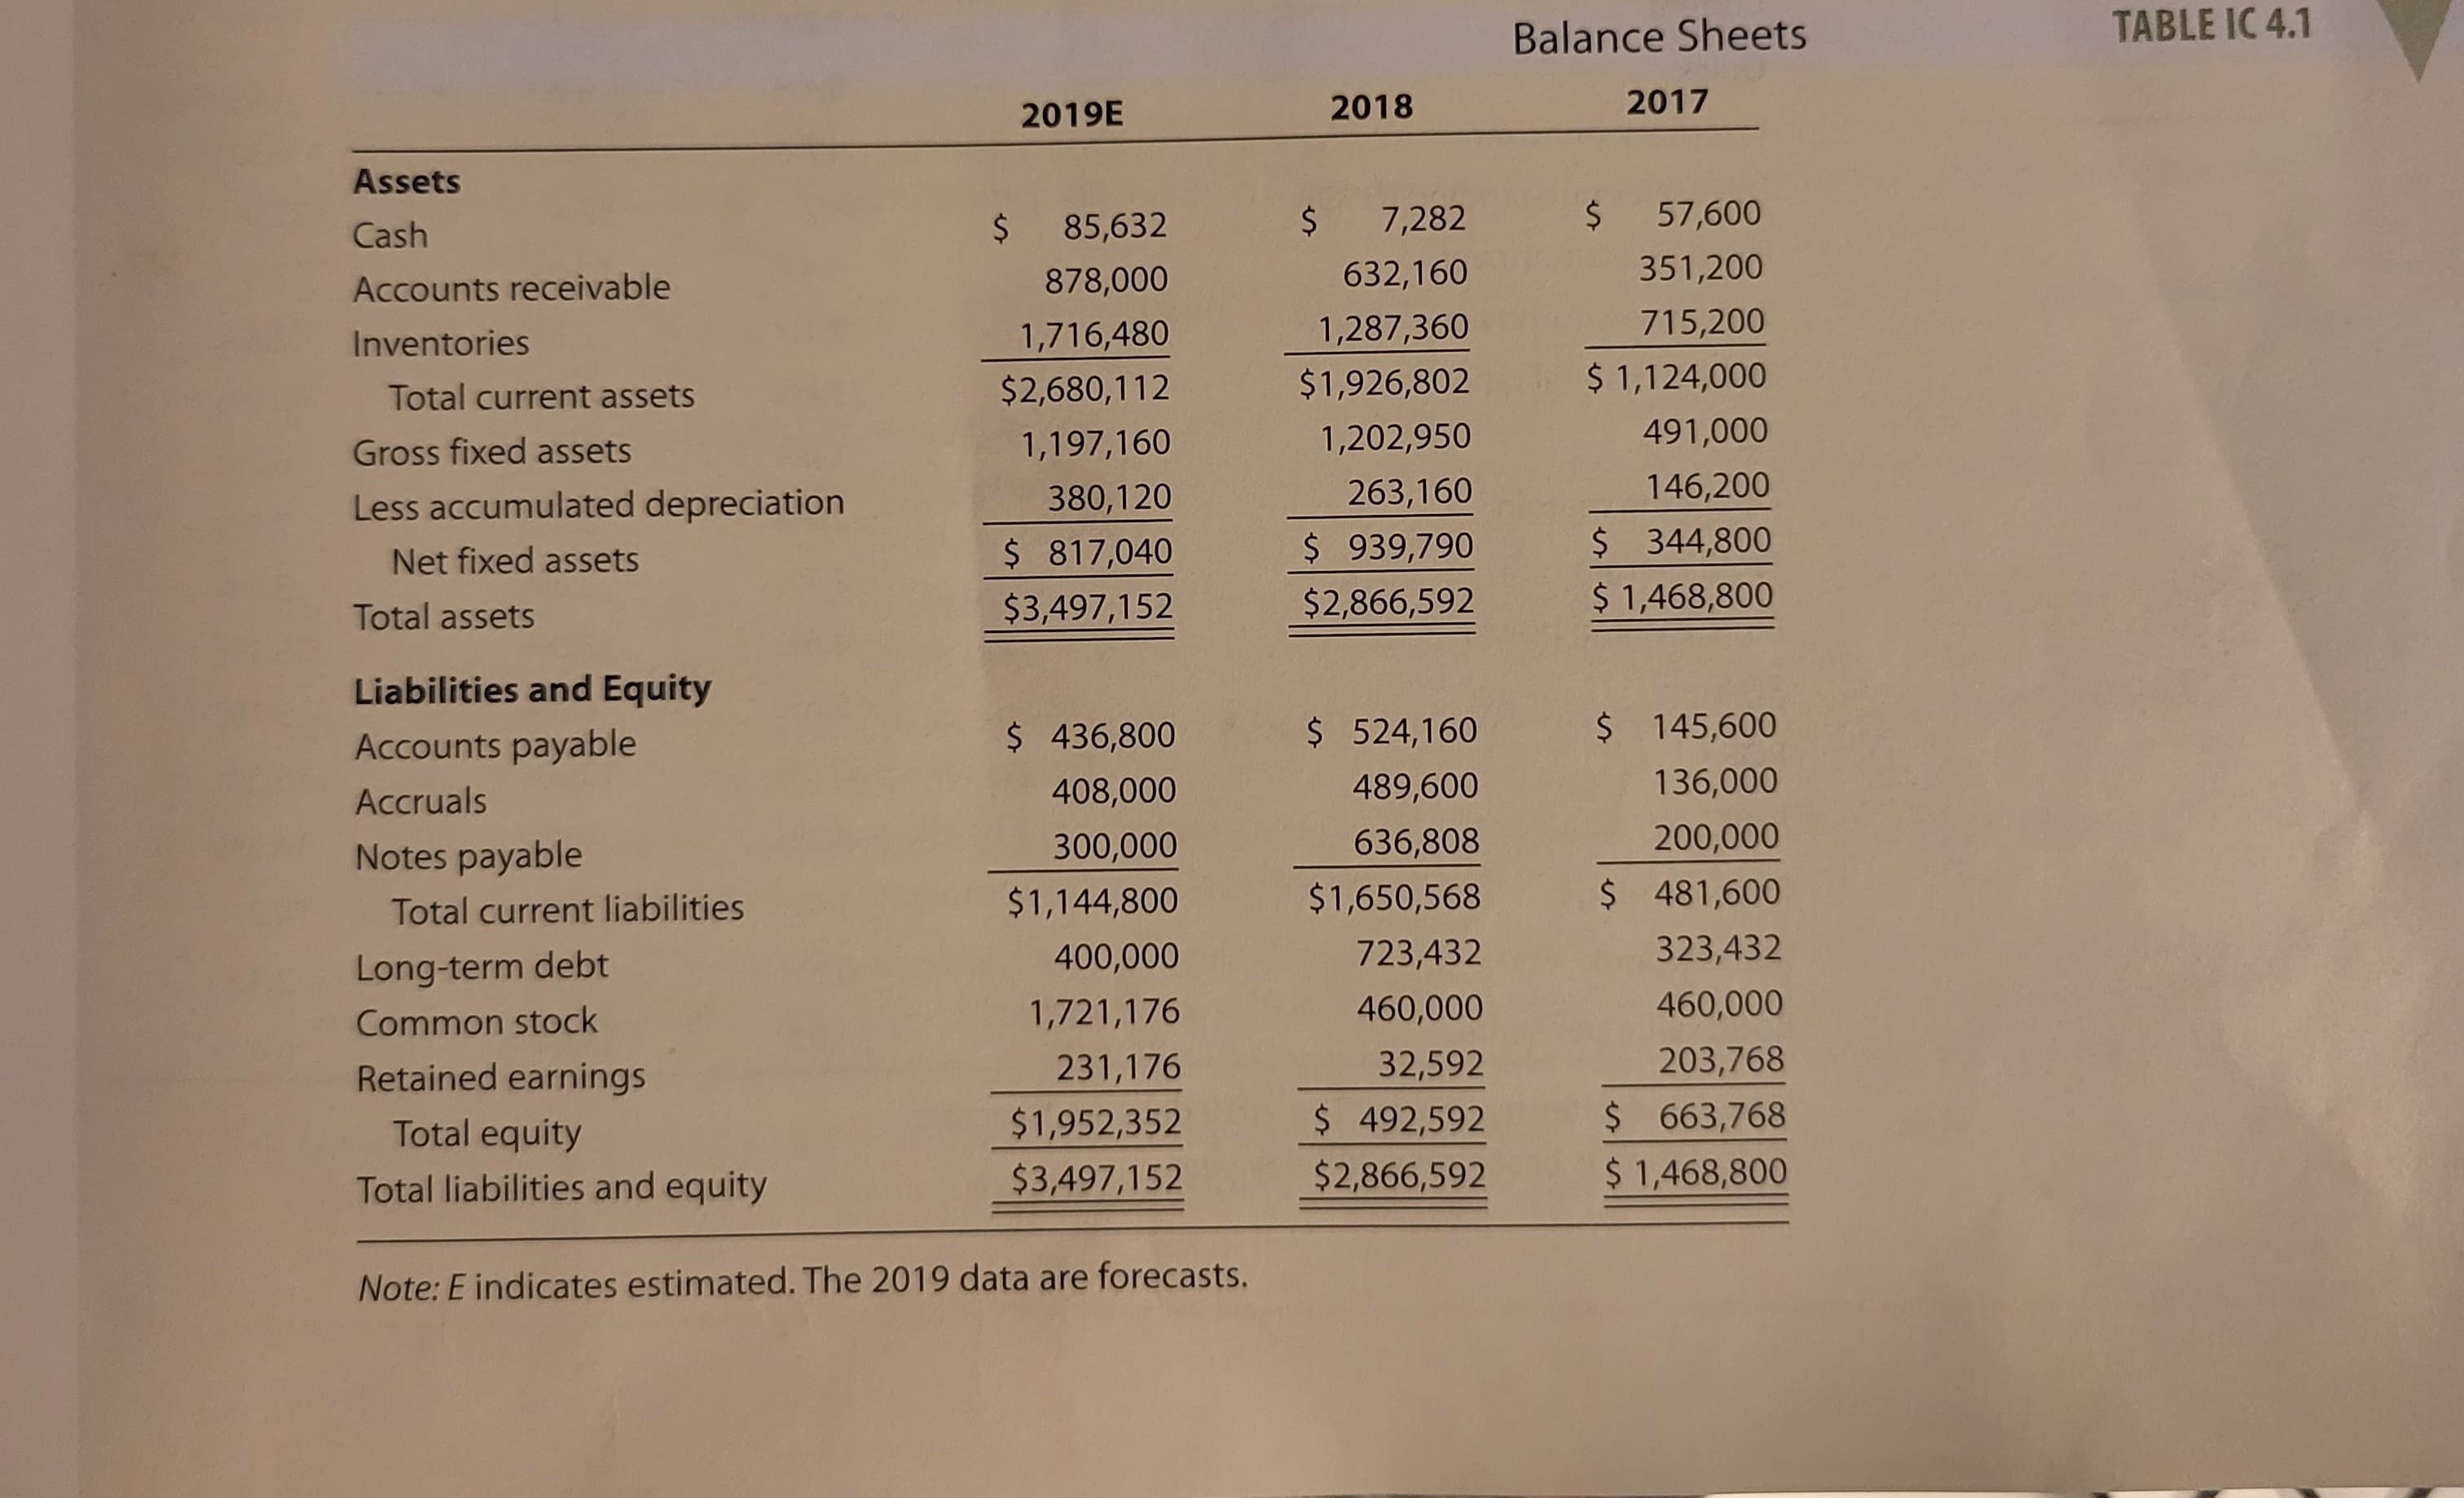
Donna Jamison was brought in as assistant to Fred Campo, D'Leon's chairman, who had the task of getting the company back into a sound financial position. D'Leon's 2017 and 2018 balance sheets and income statements, together with projections for 2019, are given in Tables IC 4.1 and IC 4.2. In addition, Table IC 4.3 gives the company's 2017 and 2018 financial ratios, together with industry average data.
The 2019 projected financial statement data represent Jamison's and Campo's best guess for 2019 results, assuming that some new financing is arranged to get the company "over the hump.
Jamison examined monthly data for 2018 (not given in the case), and she detected an improving pattern during the year. Monthly sales were rising, costs were falling, and large losses in the early months had
turned to a small profit by December. Thus, the annual data look somewhat worse than final monthly data. Also, it appears to be taking longer for the advertising program to get the message out, for the new sales
offices to generate sales, and for the new manufacturing facilities to operate efficiently. In other words, the lags between spending money and deriving benefits were longer than D'Leon's managers had anticipated. For these reasons, Jamison and Campo see hope for the company-provided it can survive in the short run
Jamison must prepare an analysis of where the company is now, what it must do to regain its financial health, and what actions should be taken. Your assignment is to help her answer the following questions
Provide clear explanations, not yes or no answers:
G. Use the DuPont equation to provide a summary and overview of D'Leon's financial condition as projected for 2019. What are the firm's major strengths and weaknesses?
- DuPont equation is ROE = ROA X Equity Multiplier
=Profit margin x Total assets turnover x Equity Multiplier
=Net Income/ Sales x Sales/Total Assets x Total Assets / Total Common Equity
H. Use the following simplified 2019 balance sheet to show, in general terms, how an improvement in the DSO would tend to affect the stock price. For example, if the company could improve its collection procedures and thereby lower its DSO from 45.6 days to the 32-day industry average without affecting sales, how would that change "ripple through" the financial statements (shown in thousands below) and influence the stock price?
Accounts receivable: $878
Other Current Assets: 1,802
Net Fixed Assets: 817
Total Assets: $3,497
Current Liabilities: $845
Debt: 700
Equity: 1,952
Liabilities Plus Equity: $3,497
Transcribed Image Text:TABLE IC 4.2
TABLE IC 4.3
Income Statements
Sales
Cost of goods sold
Other expenses
Total operating costs excluding depreciation and
amortization
EBITDA
Depreciation and amortization
EBIT
Interest expense
EBT
Taxes (40%)
Net income
EPS
DPS
Book value per share
Stock price
Shares outstanding
Tax rate
Lease payments
Sinking fund payments
Ratio Analysis
Current
Quick
Inventory turnover
Days sales outstanding (DSO)
Fixed assets turnover
Total assets turnover
Debt-to-capital ratio
TIE
Operating margin
Profit margin
Basic earning power
ROA
ROE
ROIC
Price/earnings
Market/book
2019E
$7,035,600
5,875,992
550,000
2019E
$6,425,992
$ 609,608
116,960
$ 492,648
70,008
$ 422,640
169,056
$ 253,584
$ 1.014
$ 0.220
$ 7.809
$ 12.17
250,000
40.00%
$40,000
Note: E indicates estimated. The 2019 data are forecasts.
The firm had sufficient taxable income in 2016 and 2017 to obtain its full tax refund in 2018.
Book value per share
Note: E indicates estimated. The 2019 data are forecasts.
Calculation is based on a 365-day year.
2018
1.2X
0.4X
4.7X
38.2
6.4X
2.1X
73.4%
-1.0X
-2.2%
-2.7%
-4.6%
-5.6%
-32.5%
-4.2%
-1.4X
0.5X
$4.93
0
2018
$ 6,034,000
5,528,000
519,988
$ 6,047,988
($ 13,988)
116,960
($ 130,948)
136,012
($ 266,960)
(106,784)
($ 160,176)
($ 1.602)
$ 0.110
$ 4.926
$ 2.25
100,000
40.00%
$ 40,000
2017
2.3X
0.8X
4.8X
0
37.4
10.0X
2.3X
44.1%
4.3X
5.5%
2.6%
13.0%
6.0%
13.3%
9.6%
9.7X
1.3X
$6.64
2017
$ 3,432,000
2,864,000
358,672
$3,222,672
$ 209,328
18,900
$ 190,428
43,828
$ 146,600
58,640
87,960
$
$ 0.880
$ 0.220
$6.638
$ 8.50
100,000
40.00%
$ 40,000
0
Industry Average
2.7X
1.0X
6.1X
32.0
7.0X
2.6X
40.0%
6.2X
7.3%
3.5%
19.1%
9.1%
18.2%
14.5%
14.2X
2.4X
n.a.
Transcribed Image Text:Assets
Cash
Accounts receivable
Inventories
Total current assets
Gross fixed assets
Less accumulated depreciation
Net fixed assets
Total assets
Liabilities and Equity
Accounts payable
Accruals
Notes payable
Total current liabilities
Long-term debt
Common stock
Retained earnings
Total equity
Total liabilities and equity
2019E
$
85,632
878,000
1,716,480
$2,680,112
1,197,160
380,120
$ 817,040
$3,497,152
$ 436,800
408,000
300,000
$1,144,800
400,000
1,721,176
231,176
$1,952,352
$3,497,152
Note: E indicates estimated. The 2019 data are forecasts.
2018
$ 7,282
632,160
1,287,360
$1,926,802
1,202,950
263,160
$ 939,790
$2,866,592
$ 524,160
489,600
636,808
$1,650,568
723,432
460,000
32,592
$ 492,592
$2,866,592
Balance Sheets
$
2017
57,600
351,200
715,200
$ 1,124,000
491,000
146,200
$ 344,800
$ 1,468,800
$ 145,600
136,000
200,000
$ 481,600
323,432
460,000
203,768
$ 663,768
$ 1,468,800
TABLE IC 4.1
Expert Solution
This question has been solved!
Explore an expertly crafted, step-by-step solution for a thorough understanding of key concepts.

This is a popular solution!

Trending now
This is a popular solution!

Step by step
Solved in 5 steps

Knowledge Booster


Learn more about
Need a deep-dive on the concept behind this application? Look no further. Learn more about this topic, finance and related others by exploring similar questions and additional content below.Recommended textbooks for you
Essentials Of Investments
Finance
ISBN:
9781260013924
Author:
Bodie, Zvi, Kane, Alex, MARCUS, Alan J.
Publisher:
Mcgraw-hill Education,


Essentials Of Investments
Finance
ISBN:
9781260013924
Author:
Bodie, Zvi, Kane, Alex, MARCUS, Alan J.
Publisher:
Mcgraw-hill Education,

Foundations Of Finance
Finance
ISBN:
9780134897264
Author:
KEOWN, Arthur J., Martin, John D., PETTY, J. William
Publisher:
Pearson,

Fundamentals of Financial Management (MindTap Cou…
Finance
ISBN:
9781337395250
Author:
Eugene F. Brigham, Joel F. Houston
Publisher:
Cengage Learning

Corporate Finance (The Mcgraw-hill/Irwin Series i…
Finance
ISBN:
9780077861759
Author:
Stephen A. Ross Franco Modigliani Professor of Financial Economics Professor, Randolph W Westerfield Robert R. Dockson Deans Chair in Bus. Admin., Jeffrey Jaffe, Bradford D Jordan Professor
Publisher:
McGraw-Hill Education