DO F 0 TextEdit File Edit Format View Window Help Times New Roman C Bold 12 D 1..... T-Distribution 3. Statistical Abstracts (117th edition) reports that the average amount spent annually for food by householders under 25 years of age is $2,690. A random sample of 16 people under 25 years of age who live in a university neighborhood were surveyed. The survey showed that they spent a sample mean amount of $3,220 with sample standard deviation $750. Test the claim that the mean for this neighborhood is different from the national average. Use a 5% significance level. Assume our data is normally distributed. a) State the null and alternate hypotheses. b) Would you perform a one-tailed or two-tailed test? Why? c) State the test statistic and p-value for your test. Round your answers to four decimal places. 2 Hypothesis Test Assignment (1).rtf
DO F 0 TextEdit File Edit Format View Window Help Times New Roman C Bold 12 D 1..... T-Distribution 3. Statistical Abstracts (117th edition) reports that the average amount spent annually for food by householders under 25 years of age is $2,690. A random sample of 16 people under 25 years of age who live in a university neighborhood were surveyed. The survey showed that they spent a sample mean amount of $3,220 with sample standard deviation $750. Test the claim that the mean for this neighborhood is different from the national average. Use a 5% significance level. Assume our data is normally distributed. a) State the null and alternate hypotheses. b) Would you perform a one-tailed or two-tailed test? Why? c) State the test statistic and p-value for your test. Round your answers to four decimal places. 2 Hypothesis Test Assignment (1).rtf

Glencoe Algebra 1, Student Edition, 9780079039897, 0079039898, 2018
18th Edition
ISBN:9780079039897
Author:Carter
Publisher:Carter
Chapter10: Statistics
Section: Chapter Questions
Problem 25SGR

Related questions
Question
question d and e
Transcribed Image Text:C
TextEdit File Edit Format View
View Window Help
000
1 v Times New Roman Bold
C
C12 v
स BIV
1....
Ev
0
T-Distribution
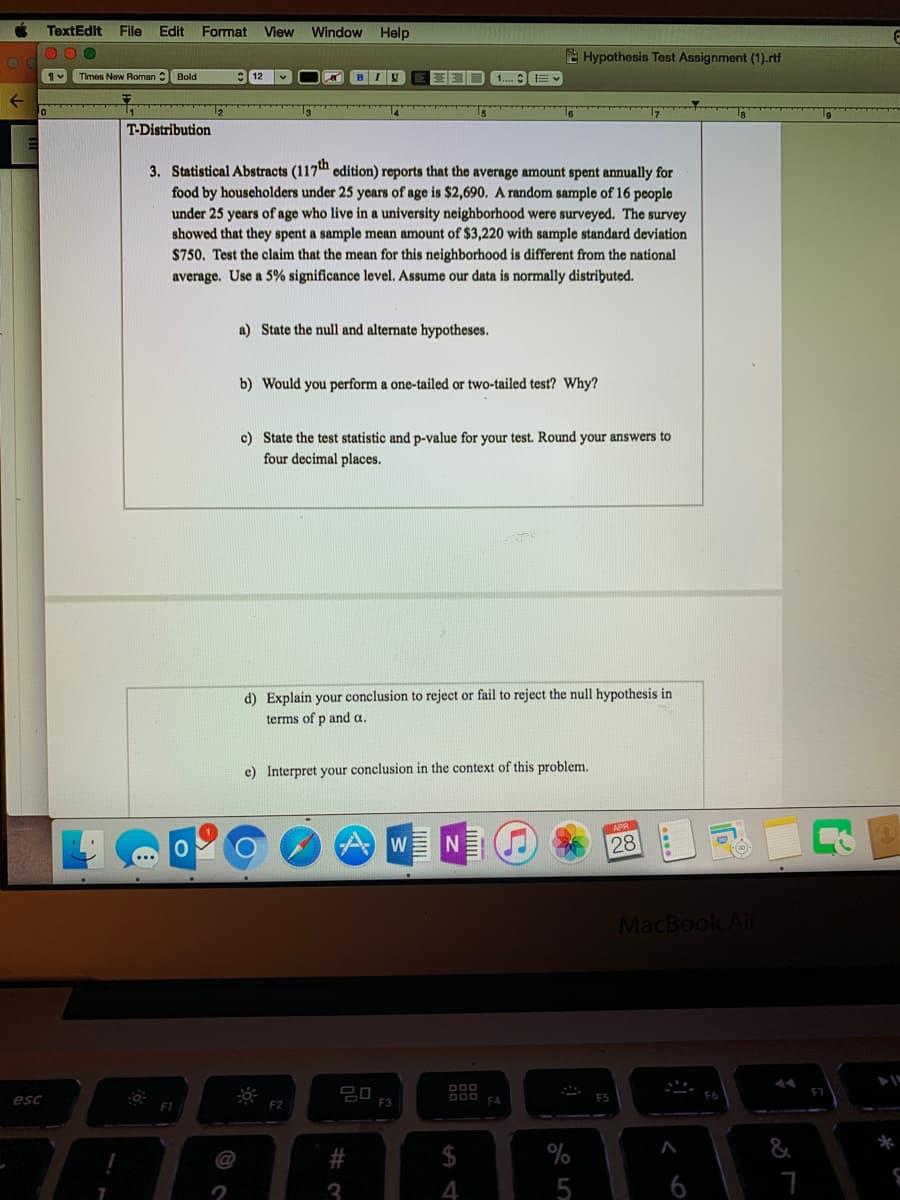
3. Statistical Abstracts (117th edition) reports that the average amount spent annually for
food by householders under 25 years of age is $2,690. A random sample of 16 people
under 25 years of age who live in a university neighborhood were surveyed. The survey
showed that they spent a sample mean amount of $3,220 with sample standard deviation
$750. Test the claim that the mean for this neighborhood is different from the national
average. Use a 5% significance level. Assume our data is normally distributed.
a) State the null and alternate hypotheses.
b) Would you perform a one-tailed or two-tailed test? Why?
c) State the test statistic and p-value for your test. Round your answers to
four decimal places.
d) Explain your conclusion to reject or fail to reject the null hypothesis in
terms of p and a.
e) Interpret your conclusion in the context of this problem.
AW
N
000
20
000 F4
O
←
esc
F1
0
F2
#3
F3
$
4
www
%
5
Hypothesis Test Assignment (1).rtf
APR
28
MacBook Air
F6
F5
^
6
&
E
Loe
F7
S
Expert Solution
This question has been solved!
Explore an expertly crafted, step-by-step solution for a thorough understanding of key concepts.

Step by step
Solved in 3 steps with 3 images

Recommended textbooks for you
Glencoe Algebra 1, Student Edition, 9780079039897…
Algebra
ISBN:
9780079039897
Author:
Carter
Publisher:
McGraw Hill
Glencoe Algebra 1, Student Edition, 9780079039897…
Algebra
ISBN:
9780079039897
Author:
Carter
Publisher:
McGraw Hill