Do left handed starting pitchers pitch more innings per game on average than right handed starting pitchers? A researcher looked at ten randomly selected left handed starting pitchers' games and eight randomly selected right handed pitchers' games. The table below shows the results. Left: 4 6 7 6 7 4 5 6 Right: 5 6 Assume that both populations follow a normal distribution. What can be concluded at the the α = 0.01 level of significance level of significance? For this study, we should use Select an answer 4 6 5 Ho: Select an answer H₁: 6 a. The null and alternative hypotheses would be: Select an answer V 8 b. The test statistic ? V 5 6 5 Select an answer Select an answer Select an answer V Select an answer V (please enter a decimal) (Please enter a decimal) (please show your answer to 3 decimal places.) c. The p-value = d. The p-value is ? V a e. Based on this, we should Select an answer V the null hypothesis. f. Thus, the final conclusion is that ... (Please show your answer to 4 decimal places.) O The results are statistically insignificant at a = 0.01, so there is statistically significant evidence to conclude that the population mean innings per game for left handed starting pitchers is equal to the population mean innings per game for right handed starting pitchers. O The results are statistically significant at a = 0.01, so there is sufficient evidence to conclude that the population mean innings per game for left handed starting pitchers is more than the population mean innings per game for right handed starting pitchers. O The results are statistically significant at a = 0.01, so there is sufficient evidence to conclude that the mean innings per game for the ten left handed starting pitchers that were looked at is more than the mean innings per game for the eight right handed starting pitchers that were looked at. The results are statistically insignificant at a = 0.01, so there is insufficient evidence to conclude that the population mean innings per game for left handed starting pitchers is more than the population mean innings per game for right handed starting pitchers. g. Interpret the p-value in the context of the study. O If the population mean innings per game for left handed starting pitchers is the same as the population mean innings per game for right handed starting pitchers and if another 10 lefties and 8 righties are observed then there would be a 20.1% chance that the mean number of innings per game for the 10 lefties would at least 0.4 innings more than the mean innings per game for the 8 righties. O If the sample mean innings per game for the 10 lefties is the same as the sample mean innings per game for the 8 righties and if another another 10 lefties and 8 righties are observed then there would be a 20.1% chance of concluding that the mean innings per game for the 10 lefties is at least 0.4 innings more than the mean innings per game for the 8 righties O There is a 20.1% chance that the mean innings per game for the 10 lefties is at least 0.4 innings more than the mean innings per game for the 8 righties. O There is a 20.1% chance of a Type I error.
Do left handed starting pitchers pitch more innings per game on average than right handed starting pitchers? A researcher looked at ten randomly selected left handed starting pitchers' games and eight randomly selected right handed pitchers' games. The table below shows the results. Left: 4 6 7 6 7 4 5 6 Right: 5 6 Assume that both populations follow a normal distribution. What can be concluded at the the α = 0.01 level of significance level of significance? For this study, we should use Select an answer 4 6 5 Ho: Select an answer H₁: 6 a. The null and alternative hypotheses would be: Select an answer V 8 b. The test statistic ? V 5 6 5 Select an answer Select an answer Select an answer V Select an answer V (please enter a decimal) (Please enter a decimal) (please show your answer to 3 decimal places.) c. The p-value = d. The p-value is ? V a e. Based on this, we should Select an answer V the null hypothesis. f. Thus, the final conclusion is that ... (Please show your answer to 4 decimal places.) O The results are statistically insignificant at a = 0.01, so there is statistically significant evidence to conclude that the population mean innings per game for left handed starting pitchers is equal to the population mean innings per game for right handed starting pitchers. O The results are statistically significant at a = 0.01, so there is sufficient evidence to conclude that the population mean innings per game for left handed starting pitchers is more than the population mean innings per game for right handed starting pitchers. O The results are statistically significant at a = 0.01, so there is sufficient evidence to conclude that the mean innings per game for the ten left handed starting pitchers that were looked at is more than the mean innings per game for the eight right handed starting pitchers that were looked at. The results are statistically insignificant at a = 0.01, so there is insufficient evidence to conclude that the population mean innings per game for left handed starting pitchers is more than the population mean innings per game for right handed starting pitchers. g. Interpret the p-value in the context of the study. O If the population mean innings per game for left handed starting pitchers is the same as the population mean innings per game for right handed starting pitchers and if another 10 lefties and 8 righties are observed then there would be a 20.1% chance that the mean number of innings per game for the 10 lefties would at least 0.4 innings more than the mean innings per game for the 8 righties. O If the sample mean innings per game for the 10 lefties is the same as the sample mean innings per game for the 8 righties and if another another 10 lefties and 8 righties are observed then there would be a 20.1% chance of concluding that the mean innings per game for the 10 lefties is at least 0.4 innings more than the mean innings per game for the 8 righties O There is a 20.1% chance that the mean innings per game for the 10 lefties is at least 0.4 innings more than the mean innings per game for the 8 righties. O There is a 20.1% chance of a Type I error.

Glencoe Algebra 1, Student Edition, 9780079039897, 0079039898, 2018
18th Edition
ISBN:9780079039897
Author:Carter
Publisher:Carter
Chapter10: Statistics
Section10.4: Distributions Of Data
Problem 19PFA

Related questions
Question
I need this ASAP.
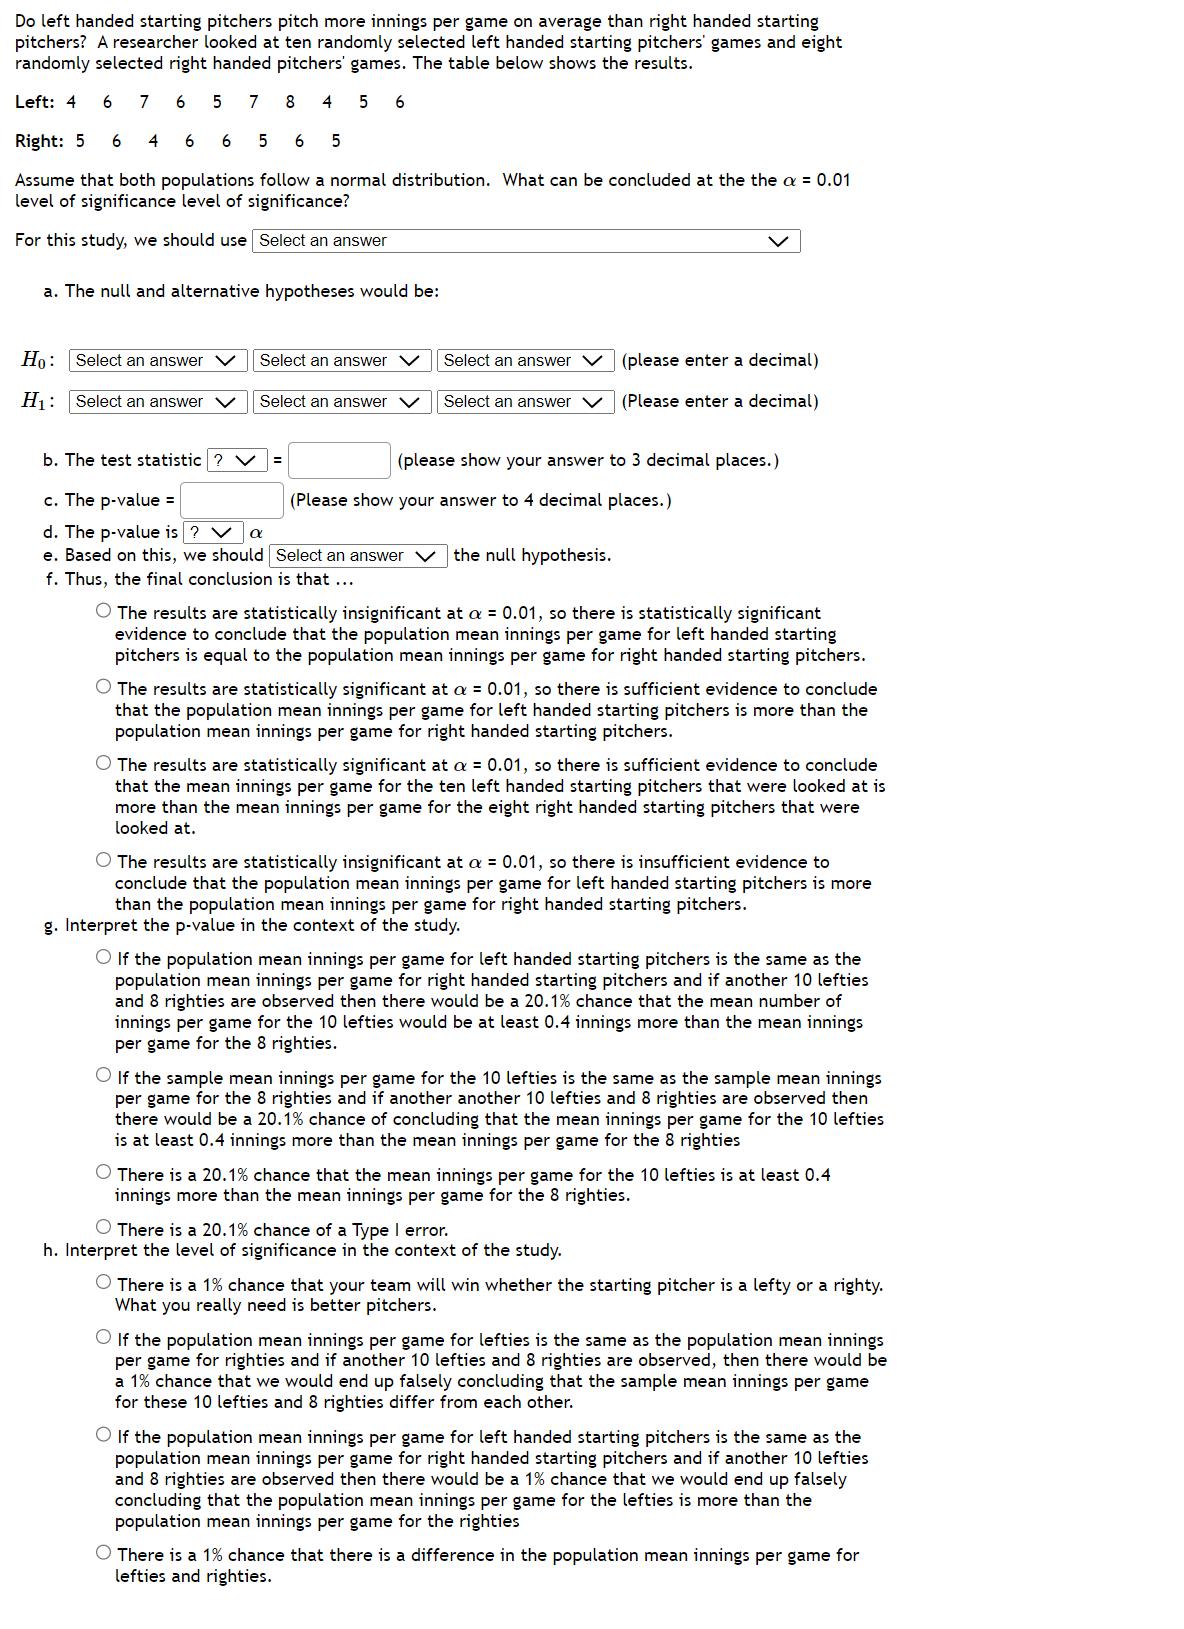
Transcribed Image Text:Do left handed starting pitchers pitch more innings per game on average than right handed starting
pitchers? A researcher looked at ten randomly selected left handed starting pitchers' games and eight
randomly selected right handed pitchers' games. The table below shows the results.
Left: 4 6 7
6
7
4 5 6
Right: 5 6
Assume that both populations follow a normal distribution. What can be concluded at the the α = 0.01
level of significance level of significance?
For this study, we should use Select an answer
4
6
5
Ho: Select an answer
H₁:
6
a. The null and alternative hypotheses would be:
Select an answer V
8
b. The test statistic ? V
5 6 5
Select an answer
Select an answer
Select an answer V
Select an answer V
(please show your answer to 3 decimal places.)
c. The p-value =
d. The p-value is ? V a
e. Based on this, we should Select an answer V the null hypothesis.
f. Thus, the final conclusion is that ...
(Please show your answer to 4 decimal places.)
(please enter a decimal)
(Please enter a decimal)
O The results are statistically insignificant at a = 0.01, so there is statistically significant
evidence to conclude that the population mean innings per game for left handed starting
pitchers is equal to the population mean innings per game for right handed starting pitchers.
O The results are statistically significant at a = 0.01, so there is sufficient evidence to conclude
that the population mean innings per game for left handed starting pitchers is more than the
population mean innings per game for right handed starting pitchers.
O The results are statistically significant at a = 0.01, so there is sufficient evidence to conclude
that the mean innings per game for the ten left handed starting pitchers that were looked at is
more than the mean innings per game for the eight right handed starting pitchers that were
looked at.
The results are statistically insignificant at a = 0.01, so there is insufficient evidence to
conclude that the population mean innings per game for left handed starting pitchers is more
than the population mean innings per game for right handed starting pitchers.
g. Interpret the p-value in the context of the study.
O If the population mean innings per game for left handed starting pitchers is the same as the
population mean innings per game for right handed starting pitchers and if another 10 lefties
and 8 righties are observed then there would be a 20.1% chance that the mean number of
innings per game for the 10 lefties would at least 0.4 innings more than the mean innings
per game for the 8 righties.
O If the sample mean innings per game for the 10 lefties is the same as the sample mean innings
per game for the 8 righties and if another another 10 lefties and 8 righties are observed then
there would be a 20.1% chance of concluding that the mean innings per game for the 10 lefties
is at least 0.4 innings more than the mean innings per game for the 8 righties
O There is a 20.1% chance that the mean innings per game for the 10 lefties is at least 0.4
innings more than the mean innings per game for the 8 righties.
O There is a 20.1% chance of a Type I error.
h. Interpret the level of significance in the context of the study.
O There is a 1% chance that your team will win whether the star
What you really need is better pitchers.
pitcher is a lefty righty.
O If the population mean innings per game for lefties is the same as the population mean innings
per game for righties and if another 10 lefties and 8 righties are observed, then there would be
a 1% chance that we would end up falsely concluding that the sample mean innings per game
for these 10 lefties and 8 righties differ from each other.
O If the population mean innings per game for left handed starting pitchers is the same as the
population mean innings per game for right handed starting pitchers and if another 10 lefties
and 8 righties are observed then there would be a 1% chance that we would end up falsely
concluding that the population mean innings per game for the lefties is more than the
population mean innings per game for the righties
O There is a 1% chance that there is a difference in the population mean innings per game for
lefties and righties.
Expert Solution
This question has been solved!
Explore an expertly crafted, step-by-step solution for a thorough understanding of key concepts.

Step by step
Solved in 3 steps with 2 images

Recommended textbooks for you
Glencoe Algebra 1, Student Edition, 9780079039897…
Algebra
ISBN:
9780079039897
Author:
Carter
Publisher:
McGraw Hill
Glencoe Algebra 1, Student Edition, 9780079039897…
Algebra
ISBN:
9780079039897
Author:
Carter
Publisher:
McGraw Hill