Do rats take less time on average than hamsters to travel through a maze? The table below shows the times in seconds that the rats and hamsters took. Rats: 18, 32, 15, 18, 38, 25, 51, 32, 27 Hamsters: 24, 28, 23, 15, 48, 53, 49, 52 Assume that both populations follow a normal distribution. What can be concluded at the a = 0.10 level of significance level of significance? For this study, we should use Select an answer a. The null and alternative hypotheses would be: Họ: Select an answer Select an answer (please enter a decimal) Hị: Select an answer' Select an answer (Please enter a decimal) | (please show your answer to 3 decimal places.) | (Please show your answer to 4 decimal places.) b. The test statistic| c. The p-value = [ d. The p-value is ? a e. Based on this, we should Select an answer the null hypothesis. f. Thus, the final conclusion is that . O The results are statistically insignificant at a = 0.10, so there is insufficient evidence to conclude that the population mean time to complete the maze for rats is less than the population mean time to complete the maze for hamsters. O The results are statistically insignificant at a = 0.10, so there is statistically significant evidence to conclude that the population mean time to complete the maze for rats is equal to the population mean time to complete the maze for hamsters. O The results are statistically significant at a = 0.10, so there is sufficient evidence to conclude that the mean time to complete the maze for the nine rats is less than the mean time to complete the maze for the eight hamsters. O The results are statistically significant at a = 0.10, so there is sufficient evidence to conclude that the population mean time to complete the maze for rats is less than the population mean time to complete the maze for hamsters.
Do rats take less time on average than hamsters to travel through a maze? The table below shows the times in seconds that the rats and hamsters took. Rats: 18, 32, 15, 18, 38, 25, 51, 32, 27 Hamsters: 24, 28, 23, 15, 48, 53, 49, 52 Assume that both populations follow a normal distribution. What can be concluded at the a = 0.10 level of significance level of significance? For this study, we should use Select an answer a. The null and alternative hypotheses would be: Họ: Select an answer Select an answer (please enter a decimal) Hị: Select an answer' Select an answer (Please enter a decimal) | (please show your answer to 3 decimal places.) | (Please show your answer to 4 decimal places.) b. The test statistic| c. The p-value = [ d. The p-value is ? a e. Based on this, we should Select an answer the null hypothesis. f. Thus, the final conclusion is that . O The results are statistically insignificant at a = 0.10, so there is insufficient evidence to conclude that the population mean time to complete the maze for rats is less than the population mean time to complete the maze for hamsters. O The results are statistically insignificant at a = 0.10, so there is statistically significant evidence to conclude that the population mean time to complete the maze for rats is equal to the population mean time to complete the maze for hamsters. O The results are statistically significant at a = 0.10, so there is sufficient evidence to conclude that the mean time to complete the maze for the nine rats is less than the mean time to complete the maze for the eight hamsters. O The results are statistically significant at a = 0.10, so there is sufficient evidence to conclude that the population mean time to complete the maze for rats is less than the population mean time to complete the maze for hamsters.

Glencoe Algebra 1, Student Edition, 9780079039897, 0079039898, 2018
18th Edition
ISBN:9780079039897
Author:Carter
Publisher:Carter
Chapter10: Statistics
Section10.4: Distributions Of Data
Problem 19PFA

Related questions
Question
Do rats take less time on average than hamsters to travel through a maze? The table below shows the times in seconds that the rats and hamsters took.
![Do rats take less time on average than hamsters to travel through a maze? The table below shows the times in
seconds that the rats and hamsters took.
Rats: 18, 32, 15, 18, 38, 25, 51, 32, 27
Нamsters: 24, 28, 23, 15, 48, 53, 49, 52
Assume that both populations follow a normal distribution. What can be concluded at the a = 0.10 level of
significance level of significance?
For this study, we should use Select an answer
a. The null and alternative hypotheses would be:
Ho: Select an answer
Select an answer (please enter a decimal)
H: Select an answer
Select an answer (Please enter a decimal)
] (please show your answer to 3 decimal places.)
| (Please show your answer to 4 decimal places.)
b. The test statistic 2
c. The p-value = |
d. The p-value is ? a
e. Based on this, we should Select an answer the null hypothesis.
f. Thus, the final conclusion is that .
O The results are statistically insignificant at a = 0.10, so there is insufficient evidence to conclude that
the population mean time to complete the maze for rats is less than the population mean time to
complete the maze for hamsters.
O The results are statistically insignificant at a = 0.10, so there is statistically significant evidence to
conclude that the population mean time to complete the maze for rats is equal to the population mean
time to complete the maze for hamsters.
The results are statistically significant at a = 0.10, so there is sufficient evidence to conclude that the
mean time to complete the maze for the nine rats is less than the mean time to complete the maze for
the eight hamsters.
O The results are statistically significant at a = 0.10, so there is sufficient evidence to conclude that the
population mean time to complete the maze for rats is less than the population mean time to complete
the maze for hamsters.](/v2/_next/image?url=https%3A%2F%2Fcontent.bartleby.com%2Fqna-images%2Fquestion%2F83212af3-1042-480e-b8d1-1015dfd32b0c%2F8d86b10f-62ea-4c9c-8fc5-f4ab68d19ca5%2Fimmvt7w_processed.png&w=3840&q=75)
Transcribed Image Text:Do rats take less time on average than hamsters to travel through a maze? The table below shows the times in
seconds that the rats and hamsters took.
Rats: 18, 32, 15, 18, 38, 25, 51, 32, 27
Нamsters: 24, 28, 23, 15, 48, 53, 49, 52
Assume that both populations follow a normal distribution. What can be concluded at the a = 0.10 level of
significance level of significance?
For this study, we should use Select an answer
a. The null and alternative hypotheses would be:
Ho: Select an answer
Select an answer (please enter a decimal)
H: Select an answer
Select an answer (Please enter a decimal)
] (please show your answer to 3 decimal places.)
| (Please show your answer to 4 decimal places.)
b. The test statistic 2
c. The p-value = |
d. The p-value is ? a
e. Based on this, we should Select an answer the null hypothesis.
f. Thus, the final conclusion is that .
O The results are statistically insignificant at a = 0.10, so there is insufficient evidence to conclude that
the population mean time to complete the maze for rats is less than the population mean time to
complete the maze for hamsters.
O The results are statistically insignificant at a = 0.10, so there is statistically significant evidence to
conclude that the population mean time to complete the maze for rats is equal to the population mean
time to complete the maze for hamsters.
The results are statistically significant at a = 0.10, so there is sufficient evidence to conclude that the
mean time to complete the maze for the nine rats is less than the mean time to complete the maze for
the eight hamsters.
O The results are statistically significant at a = 0.10, so there is sufficient evidence to conclude that the
population mean time to complete the maze for rats is less than the population mean time to complete
the maze for hamsters.
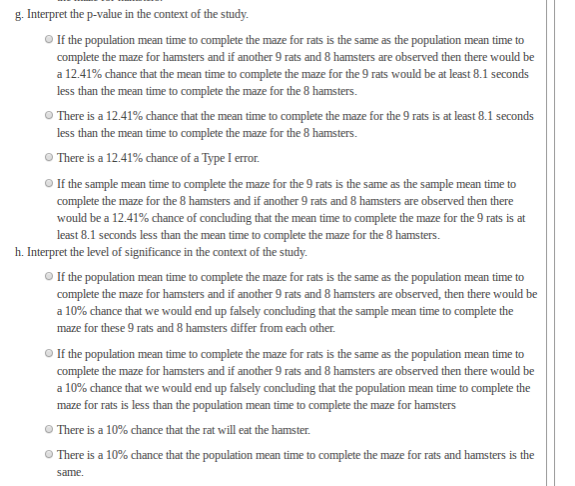
Transcribed Image Text:g. Interpret the p-value in the context of the study.
O If the population mean time to complete the maze for rats is the same as the population mean time to
complete the maze for hamsters and if another 9 rats and 8 hamsters are observed then there would be
a 12.41% chance that the mean time to complete the maze for the 9 rats would be at least 8.1 seconds
less than the mean time to complete the maze for the 8 hamsters.
O There is a 12.41% chance that the mean time to complete the maze for the 9 rats is at least 8.1 seconds
less than the mean time to complete the maze for the 8 hamsters.
There is a 12.41% chance of a Type I error.
O If the sample mean time to complete the maze for the 9 rats is the same as the sample mean time to
complete the maze for the 8 hamsters and if another 9 rats and 8 hamsters are observed then there
would be a 12.41% chance of concluding that the mean time to complete the maze for the 9 rats is at
least 8.1 seconds less than the mean time to complete the maze for the 8 hamsters.
h. Interpret the level of significance in the context of the study.
O If the population mean time to complete the maze for rats is the same as the population mean time to
complete the maze for hamsters and if another 9 rats and 8 hamsters are observed, then there would be
a 10% chance that we would end up falsely concluding that the sample mean time to complete the
maze for these 9 rats and 8 hamsters differ from each other.
O If the population mean time to complete the maze for rats is the same as the population mean time to
complete the maze for hamsters and if another 9 rats and 8 hamsters are observed then there would be
a 10% chance that we would end up falsely concluding that the population mean time to complete the
maze for rats is less than the population mean time to complete the maze for hamsters
O There is a 10% chance that the rat will eat the hamster.
O There is a 10% chance that the population mean time to complete the maze for rats and hamsters is the
same.
Expert Solution
This question has been solved!
Explore an expertly crafted, step-by-step solution for a thorough understanding of key concepts.

This is a popular solution!

Trending now
This is a popular solution!

Step by step
Solved in 5 steps

Knowledge Booster


Learn more about
Need a deep-dive on the concept behind this application? Look no further. Learn more about this topic, statistics and related others by exploring similar questions and additional content below.Recommended textbooks for you
Glencoe Algebra 1, Student Edition, 9780079039897…
Algebra
ISBN:
9780079039897
Author:
Carter
Publisher:
McGraw Hill
Glencoe Algebra 1, Student Edition, 9780079039897…
Algebra
ISBN:
9780079039897
Author:
Carter
Publisher:
McGraw Hill