Do these data provide evidence that there is an association between age group and the response to the question? Test the relevant hypotheses using a = 0.01. State the appropriate null and alternative hypotheses. O H;: There is no association between age group and the response to the question. H: There is an association between age group and the response to the question. O H,: There is an association between age group and the response to the question. H.: H: There is no association between age group and the response to the question. O Ho: The proportions falling into each of the three age groups are not the same for all four responses to the question. H: The proportions falling into each of the three age groups are the same for all four responses to the question. Ho: The proportions falling into each of the three age groups are the same for all four responses to the question. H: The proportions falling into each of the three age groups are not the same for all four responses to the question. Calculate the test statistic. (Round your answer to two decimal places.) Use technology to calculate the P-value. (Round your answer to four decimal places.) p-value = [ State the conclusion in the problem context. Fail to reject H,. There is not convincing evidence that there is an association between age group and the response to the question. O Fail to reject H,: There is convincing evidence that there is an association between age group and the response to the question. O Reject H.. There is not convincing evidence that there is an association between age group and the response to the question. Reject H,. There is convincing evidence that there is an association between age group and the response to the question.
Do these data provide evidence that there is an association between age group and the response to the question? Test the relevant hypotheses using a = 0.01. State the appropriate null and alternative hypotheses. O H;: There is no association between age group and the response to the question. H: There is an association between age group and the response to the question. O H,: There is an association between age group and the response to the question. H.: H: There is no association between age group and the response to the question. O Ho: The proportions falling into each of the three age groups are not the same for all four responses to the question. H: The proportions falling into each of the three age groups are the same for all four responses to the question. Ho: The proportions falling into each of the three age groups are the same for all four responses to the question. H: The proportions falling into each of the three age groups are not the same for all four responses to the question. Calculate the test statistic. (Round your answer to two decimal places.) Use technology to calculate the P-value. (Round your answer to four decimal places.) p-value = [ State the conclusion in the problem context. Fail to reject H,. There is not convincing evidence that there is an association between age group and the response to the question. O Fail to reject H,: There is convincing evidence that there is an association between age group and the response to the question. O Reject H.. There is not convincing evidence that there is an association between age group and the response to the question. Reject H,. There is convincing evidence that there is an association between age group and the response to the question.

Holt Mcdougal Larson Pre-algebra: Student Edition 2012
1st Edition
ISBN:9780547587776
Author:HOLT MCDOUGAL
Publisher:HOLT MCDOUGAL
Chapter11: Data Analysis And Probability
Section: Chapter Questions
Problem 8CR

Related questions
Question
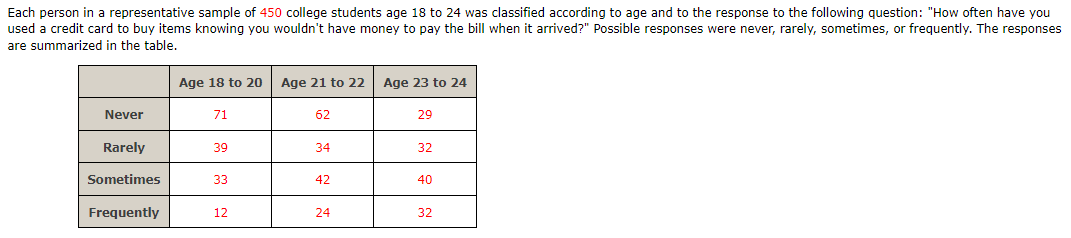
Transcribed Image Text:Each person in a representative sample of 450 college students age 18 to 24 was classified according to age and to the response to the following question: "How often have you
used a credit card to buy items knowing you wouldn't have money to pay the bill when it arrived?" Possible responses were never, rarely, sometimes, or frequently. The responses
are summarized in the table.
Age 18 to 20
Age 21 to 22
Age 23 to 24
Never
71
62
29
Rarely
39
34
32
Sometimes
33
42
40
Frequently
12
24
32
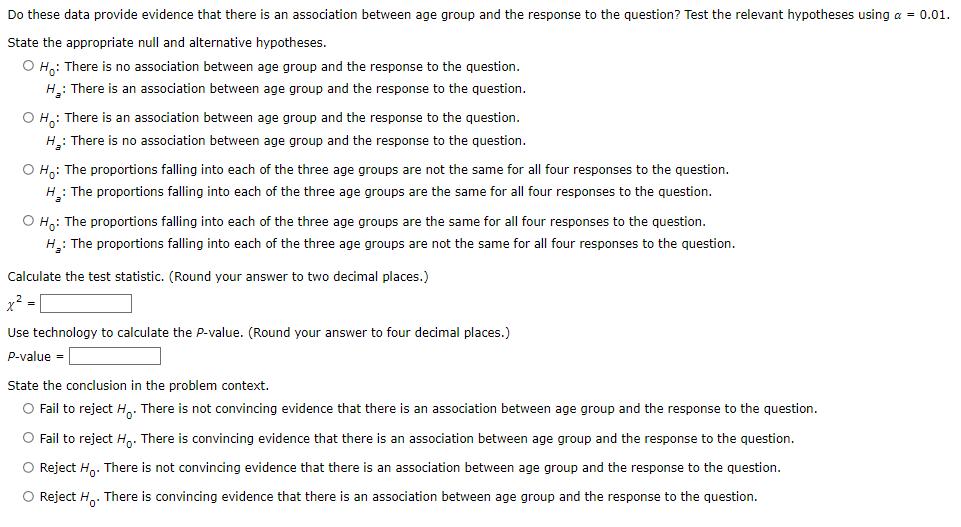
Transcribed Image Text:Do these data provide evidence that there is an association between age group and the response to the question? Test the relevant hypotheses using a = 0.01.
State the appropriate null and alternative hypotheses.
O H: There is no association between age group and the response to the question.
H.: There is an association between age group and the response to the question.
O H: There is an association between age group and the response to the question.
H.: There is no association between age group and the response to the question.
O Ha: The proportions falling into each of the three age groups are not the same for all four responses to the question.
H : The proportions falling into each of the three age groups are the same for all four responses to the question.
O H,: The proportions falling into each of the three age groups are the same for all four responses to the question.
H: The proportions falling into each of the three age groups are not the same for all four responses to the question.
Calculate the test statistic. (Round your answer to two decimal places.)
x? -
Use technology to calculate the P-value. (Round your answer to four decimal places.)
P-value =
State the conclusion in the problem context.
O Fail to reject H.. There is not convincing evidence that there is an association between age group and the response to the question.
O Fail to reject H.. There is convincing evidence that there is an association between age group and the response to the question.
O Reject H,. There is not convincing evidence that there is an association between age group and the response to the question.
O Reject H.. There is convincing evidence that there is an association between age group and the response to the question.
Expert Solution
This question has been solved!
Explore an expertly crafted, step-by-step solution for a thorough understanding of key concepts.

Step by step
Solved in 3 steps with 7 images

Recommended textbooks for you
Holt Mcdougal Larson Pre-algebra: Student Edition…
Algebra
ISBN:
9780547587776
Author:
HOLT MCDOUGAL
Publisher:
HOLT MCDOUGAL

Glencoe Algebra 1, Student Edition, 9780079039897…
Algebra
ISBN:
9780079039897
Author:
Carter
Publisher:
McGraw Hill

Holt Mcdougal Larson Pre-algebra: Student Edition…
Algebra
ISBN:
9780547587776
Author:
HOLT MCDOUGAL
Publisher:
HOLT MCDOUGAL
Glencoe Algebra 1, Student Edition, 9780079039897…
Algebra
ISBN:
9780079039897
Author:
Carter
Publisher:
McGraw Hill