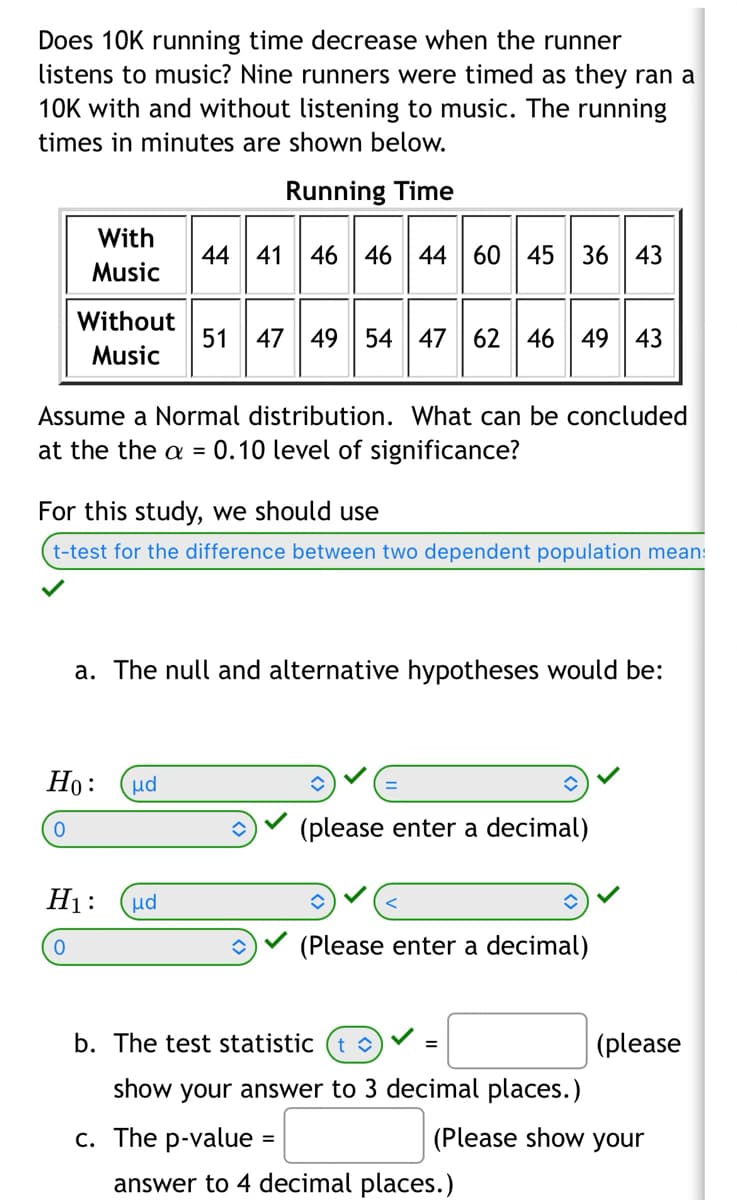
Does 10K running time decrease when the runner listens to music? Nine runners were timed as they ran a 10K with and without listening to music. The running times in minutes are shown below. Running Time With Music Without Music Assume a Normal distribution. What can be concluded at the the a = 0.10 level of significance? 44 41 46 46 44 60 45 36 43 For this study, we should use t-test for the difference between two dependent population mear Ho: μd 0 51 47 49 54 47 62 46 49 43 47 62 46 a. The null and alternative hypotheses would be: H₁: 0 μd (please enter a decimal) (Please enter a decimal) b. The test statistic î show your answer to 3 decimal places.) c. The p-value = (please (Please show your answer to 4 decimal places.)
Does 10K running time decrease when the runner listens to music? Nine runners were timed as they ran a 10K with and without listening to music. The running times in minutes are shown below. Running Time With Music Without Music Assume a Normal distribution. What can be concluded at the the a = 0.10 level of significance? 44 41 46 46 44 60 45 36 43 For this study, we should use t-test for the difference between two dependent population mear Ho: μd 0 51 47 49 54 47 62 46 49 43 47 62 46 a. The null and alternative hypotheses would be: H₁: 0 μd (please enter a decimal) (Please enter a decimal) b. The test statistic î show your answer to 3 decimal places.) c. The p-value = (please (Please show your answer to 4 decimal places.)

A First Course in Probability (10th Edition)
10th Edition
ISBN:9780134753119
Author:Sheldon Ross
Publisher:Sheldon Ross
Chapter1: Combinatorial Analysis
Section: Chapter Questions
Problem 1.1P: a. How many different 7-place license plates are possible if the first 2 places are for letters and...

Related questions
Question
B AND C ONLY
Transcribed Image Text:Does 10K running time decrease when the runner
listens to music? Nine runners were timed as they ran a
10K with and without listening to music. The running
times in minutes are shown below.
With
Music
Without
Music
44 41
Ho: μd
0
Assume a Normal distribution. What can be concluded
at the the a = 0.10 level of significance?
H₁:
0
Running Time
For this study, we should use
t-test for the difference between two dependent population mean:
μd
46 46 44 60 45 36 43
51 47 49 54 47 62 46 49 43
a. The null and alternative hypotheses would be:
=
(please enter a decimal)
(Please enter a decimal)
b. The test statistic (t
show your answer to 3 decimal places.)
c. The p-value
=
(please
(Please show your
answer to 4 decimal places.)
Expert Solution
This question has been solved!
Explore an expertly crafted, step-by-step solution for a thorough understanding of key concepts.

Step by step
Solved in 2 steps with 4 images

Recommended textbooks for you
A First Course in Probability (10th Edition)
Probability
ISBN:
9780134753119
Author:
Sheldon Ross
Publisher:
PEARSON

A First Course in Probability (10th Edition)
Probability
ISBN:
9780134753119
Author:
Sheldon Ross
Publisher:
PEARSON