Does the location of your seat in a classroom play a role in attendance or grade? 1600 students in a physics course were randomly assigned to one of four groups. The 400 students in group 1 sat 0 to 4 meters from the fro the class, the 400 students in group 2 sat 4 to 6.5 meters from the front, the 400 students in group 3 sat 6.5 to 9 meters from the front, and the 400 students in group 4 sat 9 to 12 meters from the front. Complete parts (a) through (c). (a) For the first half of the semester, the attendance for the whole class averaged 76%. So, if there is no effect due to seat location, we would expect 76% of students in each group to attend. The data show the attendance history for each group. How many students in each group attended, on average? Is there a significant difference among the groups in attendance patterns? Group Attendance 1 2 3 4 0.77 0.77 0.75 0.75 The number of students who attended in the first group was 308 The number of students who attended in the second group was 308 . The number of students who attended in the third group was 300 The number of students who attended in the fourth group was 300 What are the hypotheses? Ho: The average attendance in each group is the same as the average attendance for the class. H,: The average attendance in each group is different from the average attendance for the class. What is the test statistic? x = 0.211 (Round to three decimal places as needed.) What is the range of P-values of the test? The range of P-values of the test is
Does the location of your seat in a classroom play a role in attendance or grade? 1600 students in a physics course were randomly assigned to one of four groups. The 400 students in group 1 sat 0 to 4 meters from the fro the class, the 400 students in group 2 sat 4 to 6.5 meters from the front, the 400 students in group 3 sat 6.5 to 9 meters from the front, and the 400 students in group 4 sat 9 to 12 meters from the front. Complete parts (a) through (c). (a) For the first half of the semester, the attendance for the whole class averaged 76%. So, if there is no effect due to seat location, we would expect 76% of students in each group to attend. The data show the attendance history for each group. How many students in each group attended, on average? Is there a significant difference among the groups in attendance patterns? Group Attendance 1 2 3 4 0.77 0.77 0.75 0.75 The number of students who attended in the first group was 308 The number of students who attended in the second group was 308 . The number of students who attended in the third group was 300 The number of students who attended in the fourth group was 300 What are the hypotheses? Ho: The average attendance in each group is the same as the average attendance for the class. H,: The average attendance in each group is different from the average attendance for the class. What is the test statistic? x = 0.211 (Round to three decimal places as needed.) What is the range of P-values of the test? The range of P-values of the test is

Glencoe Algebra 1, Student Edition, 9780079039897, 0079039898, 2018
18th Edition
ISBN:9780079039897
Author:Carter
Publisher:Carter
Chapter10: Statistics
Section10.6: Summarizing Categorical Data
Problem 13CYU

Related questions
Question
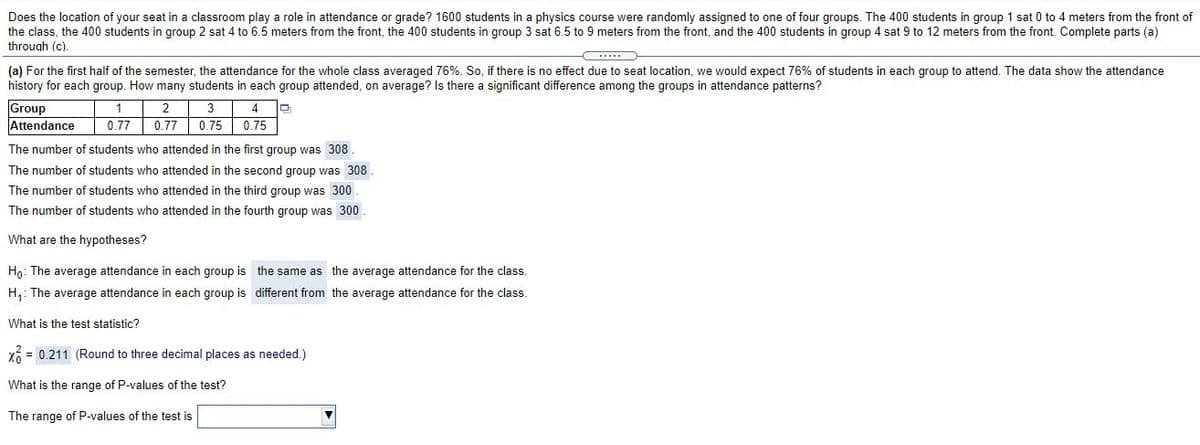
Transcribed Image Text:Does the location of your seat in a classroom play a role in attendance or grade? 1600 students in a physics course were randomly assigned to one of four groups. The 400 students in group 1 sat 0 to 4 meters from the front of
the class, the 400 students in group 2 sat 4 to 6.5 meters from the front, the 400 students in group 3 sat 6.5 to 9 meters from the front, and the 400 students in group 4 sat 9 to 12 meters from the front. Complete parts (a)
through (c).
...
(a) For the first half of the semester, the attendance for the whole class averaged 76%. So, if there is no effect due to seat location, we would expect 76% of students in each group to attend. The data show the attendance
history for each group. How many students in each group attended, on average? Is there a significant difference among the groups in attendance patterns?
Group
Attendance
2
3
4
0.77
0.77
0.75
0.75
The number of students who attended in the first group was 308.
The number of students who attended in the second group was 308
The number of students who attended in the third group was 300
The number of students who attended in the fourth group was 300
What are the hypotheses?
Ho: The average attendance in each group is the same as the average attendance for the class.
H,: The average attendance in each group is different from the average attendance for the class.
What is the test statistic?
X6 = 0.211 (Round to three decimal places as needed.)
What is the range of P-values of the test?
The range of P-values of the test is
Expert Solution
This question has been solved!
Explore an expertly crafted, step-by-step solution for a thorough understanding of key concepts.

This is a popular solution!

Trending now
This is a popular solution!

Step by step
Solved in 2 steps

Recommended textbooks for you
Glencoe Algebra 1, Student Edition, 9780079039897…
Algebra
ISBN:
9780079039897
Author:
Carter
Publisher:
McGraw Hill

Holt Mcdougal Larson Pre-algebra: Student Edition…
Algebra
ISBN:
9780547587776
Author:
HOLT MCDOUGAL
Publisher:
HOLT MCDOUGAL
Glencoe Algebra 1, Student Edition, 9780079039897…
Algebra
ISBN:
9780079039897
Author:
Carter
Publisher:
McGraw Hill
Holt Mcdougal Larson Pre-algebra: Student Edition…
Algebra
ISBN:
9780547587776
Author:
HOLT MCDOUGAL
Publisher:
HOLT MCDOUGAL