$1 billion 15 30 45 60 75 00 MONEY (Billions of dollars) $0.25 billion hat for each one-percentage-point increase in the interest rate, the level of investment spending declines by $1 billion. The change in st rate (according to the change you made to-the money market in the previous scenario) therefore causes the level of investment by nultiplier effect is accounted for, the change in investment spending will cause the quantity of output demanded Av by t spending is known as the at each price level. The impact of an increase in government purchases on the interest rate and the level of effect. rple line (diamond symbol) on the graph at the beginning of this problem to show the aggregate demand curve (AD) after accounting for of the increase in government purchases on the interest rate and the level of investment spending. ure your final aggregate demand curve (AD3) is parallel to AD, and AD2. You can see the slopes of AD, and AD, by selecting them ph. crowding-out automatic stabilizer
$1 billion 15 30 45 60 75 00 MONEY (Billions of dollars) $0.25 billion hat for each one-percentage-point increase in the interest rate, the level of investment spending declines by $1 billion. The change in st rate (according to the change you made to-the money market in the previous scenario) therefore causes the level of investment by nultiplier effect is accounted for, the change in investment spending will cause the quantity of output demanded Av by t spending is known as the at each price level. The impact of an increase in government purchases on the interest rate and the level of effect. rple line (diamond symbol) on the graph at the beginning of this problem to show the aggregate demand curve (AD) after accounting for of the increase in government purchases on the interest rate and the level of investment spending. ure your final aggregate demand curve (AD3) is parallel to AD, and AD2. You can see the slopes of AD, and AD, by selecting them ph. crowding-out automatic stabilizer

Chapter6: Systems Of Equations And Inequalities
Section: Chapter Questions
Problem 21T: A manufacturer produces two models of television stands. The table at the left shows the times (in...

Related questions
Question
PLEASE ANSWER ALL QUESTIONS NOT JUST SOME
PLEASE WRITE THE EXACT NUMBERS FOR THE GRAPH.
PLEASE READ CAREFULLY, THIS MAY BE A SIMILAR QUESTION, BUT ALL QUESTIONS ARE DIFFERENT
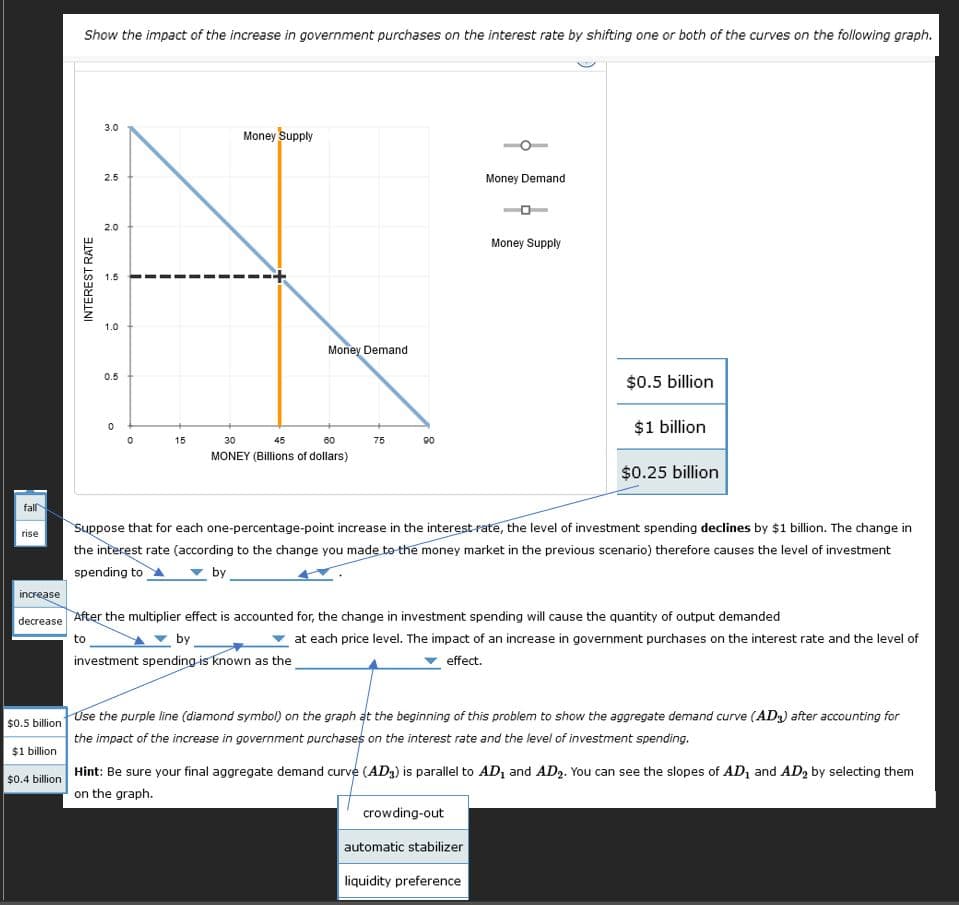
Transcribed Image Text:Show the impact of the increase in government purchases on the interest rate by shifting one or both of the curves on the following graph.
3.0
Money Supply
2.5
Money Demand
2.0
Money Supply
1.5
1.0
Money Demand
0.5
$0.5 billion
$1 billion
15
30
45
60
75
90
MONEY (Billions of dollars)
$0.25 billion
fall
Suppose that for each one-percentage-point increase in the interest-rate, the level of investment spending declines by $1 billion. The change in
the interest rate (according to the change you made to the money market in the previous scenario) therefore causes the level of investment
spending to
rise
by
increase
decrease After the multiplier effect is accounted for, the change in investment spending will cause the quantity of output demanded
to
by
at each price level. The impact of an increase in government purchases on the interest rate and the level of
investment spending is known as the
effect.
S0.5 bilion Use the purpie line (diamond symbol) on the graph at the beginning of this problem to show the aggregate demand curve (AD3) after accounting for
the impact of the increase in government purchases on the interest rate and the level of investment spending.
$1 billion
S0 4 bilion Hint: Be sure your final aggregate demand curve (AD3) is parallel to AD, and AD2. You can see the slopes of AD, and AD, by selecting them
on the graph.
crowding-out
automatic stabilizer
liquidity preference
INTEREST RATE
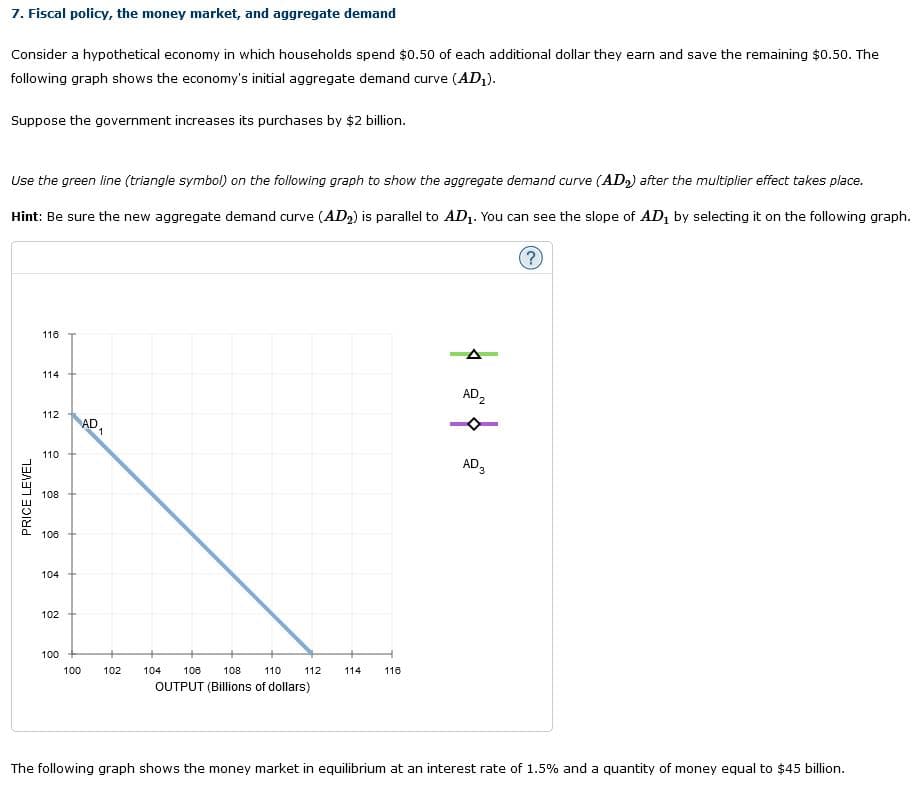
Transcribed Image Text:7. Fiscal policy, the money market, and aggregate demand
Consider a hypothetical economy in which households spend $0.50 of each additional dollar they earn and save the remaining $0.50. The
following graph shows the economy's initial aggregate demand curve (AD;).
Suppose the government increases its purchases by $2 billion.
Use the green line (triangle symbol) on the following graph to show the aggregate demand curve (AD2) after the multiplier effect takes place.
Hint: Be sure the new aggregate demand curve (AD2) is parallel to AD1. You can see the slope of AD1 by selecting it on the following graph.
116
114
AD 2
112
AD
1
110
AD2
108
106
104
102
100
100
102
104
108
108
110
112
114
116
OUTPUT (Billions of dollars)
The following graph shows the money market in equilibrium at an interest rate of 1.5% and a quantity of money equal to $45 billion.
PRICE LEVEL
Expert Solution
This question has been solved!
Explore an expertly crafted, step-by-step solution for a thorough understanding of key concepts.

This is a popular solution!

Trending now
This is a popular solution!

Step by step
Solved in 2 steps with 6 images

Recommended textbooks for you