Douglas Fur is a small manufacturer of fake-fur boots in Houston. The following table shows the company's total cost of production at various production quantities.
Douglas Fur is a small manufacturer of fake-fur boots in Houston. The following table shows the company's total cost of production at various production quantities.

Chapter6: Proudction Costs
Section: Chapter Questions
Problem 8SQP

Related questions
Question
100%
How do I solve this chart
Transcribed Image Text:JEV8/Ikdexhtml?deploymentld=58830023220612202193347127562&elSBN=9781337622349&id=908491103&snapshotld=1937530&
CENGAGE MINDTAP
Homework (Ch 07)
Attempts:
Average: /2
3. Short-run cost formulas
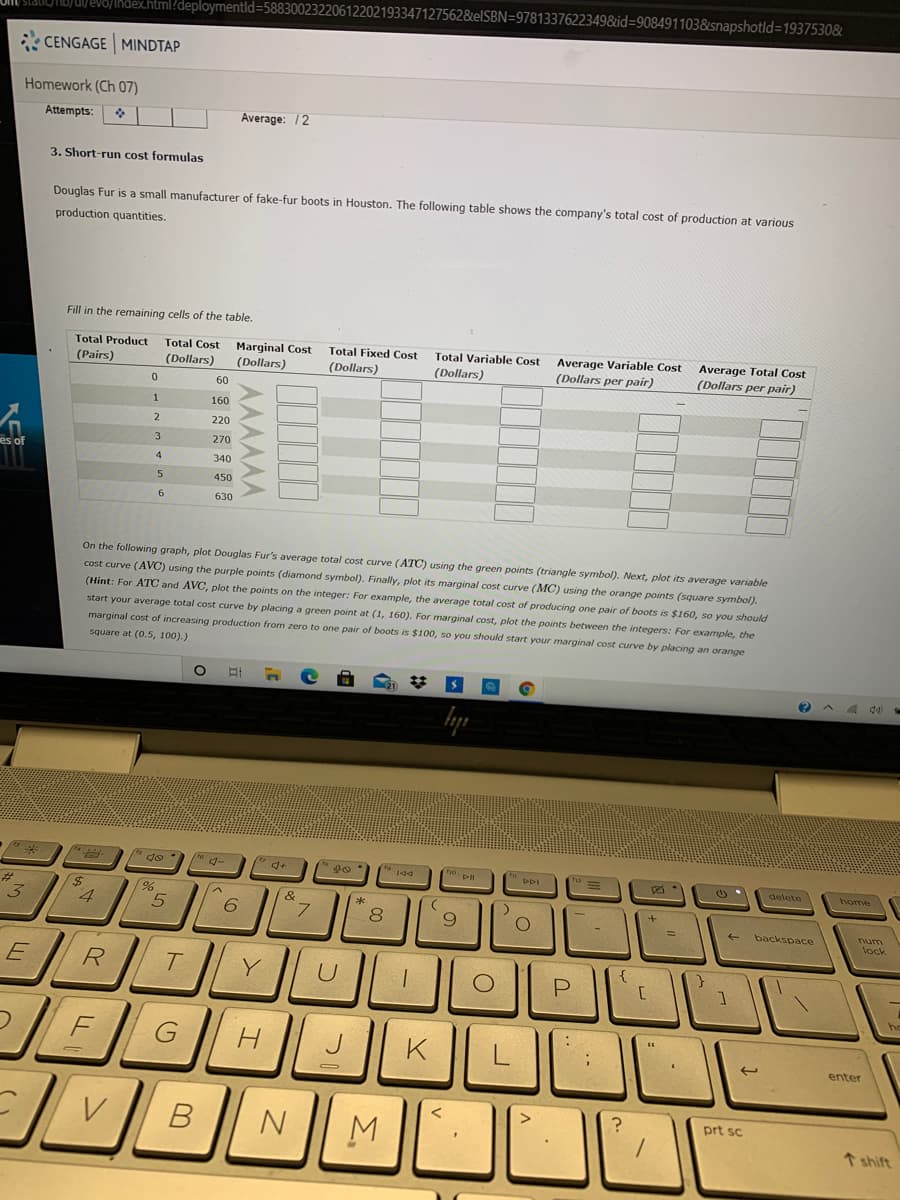
Douglas Fur is a small manufacturer of fake-fur boots in Houston. The following table shows the company's total cost of production at various
production quantities.
Fill in the remaining cells of the table.
Total Product
Total Cost
Marginal Cost
(Dollars)
Total Fixed Cost
Total Variable Cost
Average Variable Cost
(Dollars per pair)
Average Total Cost
(Dollars per pair)
(Pairs)
(Dollars)
(Dollars)
(Dollars)
60
160
220
3.
270
es of
4.
340
450
630
On the following graph, plot Douglas Fur's average total cost curve (ATC) using the green points (triangle symbol). Next, plot its average variable
cost curve (AVC) using the purple points (diamond symbol). Finally, plot its marginal cost curve (MC) using the orange points (square symbol).
(Hint: For ATC and AVC, plot the points on the integer: For example, the average total cost of producing one pair of boots is $160, so you should
start your average total cost curve by placing a green point at (1, 160). For marginal cost, plot the points between the integers: For example, the
marginal cost of increasing production from zero to one pair of boots is $100, so you should start your marginal cost curve by placing an orange
square at (0.5, 100).)
*
5 do
tho pl
DDI
delete
home
%23
4
8
num
lock
backspace
R.
Y
G
K
enter
prt sc
N
↑ shift
AMAAAA
B.
Transcribed Image Text:* MindTap - Cengage Learning
x +
Link to Book and Mindtap
Canvas | Canvas
ng.cengage.com/static/nb/ui/evo/index.html?deploymentld=58830023220612202193347127562&elSBN=9781337622349&id%3908491103&snapshotld=1937530&
CENGAGE MINDTAP
Shawnta v
My Home
Homework (Ch 07)
---s
60
2 Courses
1
160
O Catalog and Study Tools
220
3
270
* Partner Offers
4
340
450
O Rental Options
6.
630
* College Success Tips
e Career Success Tips
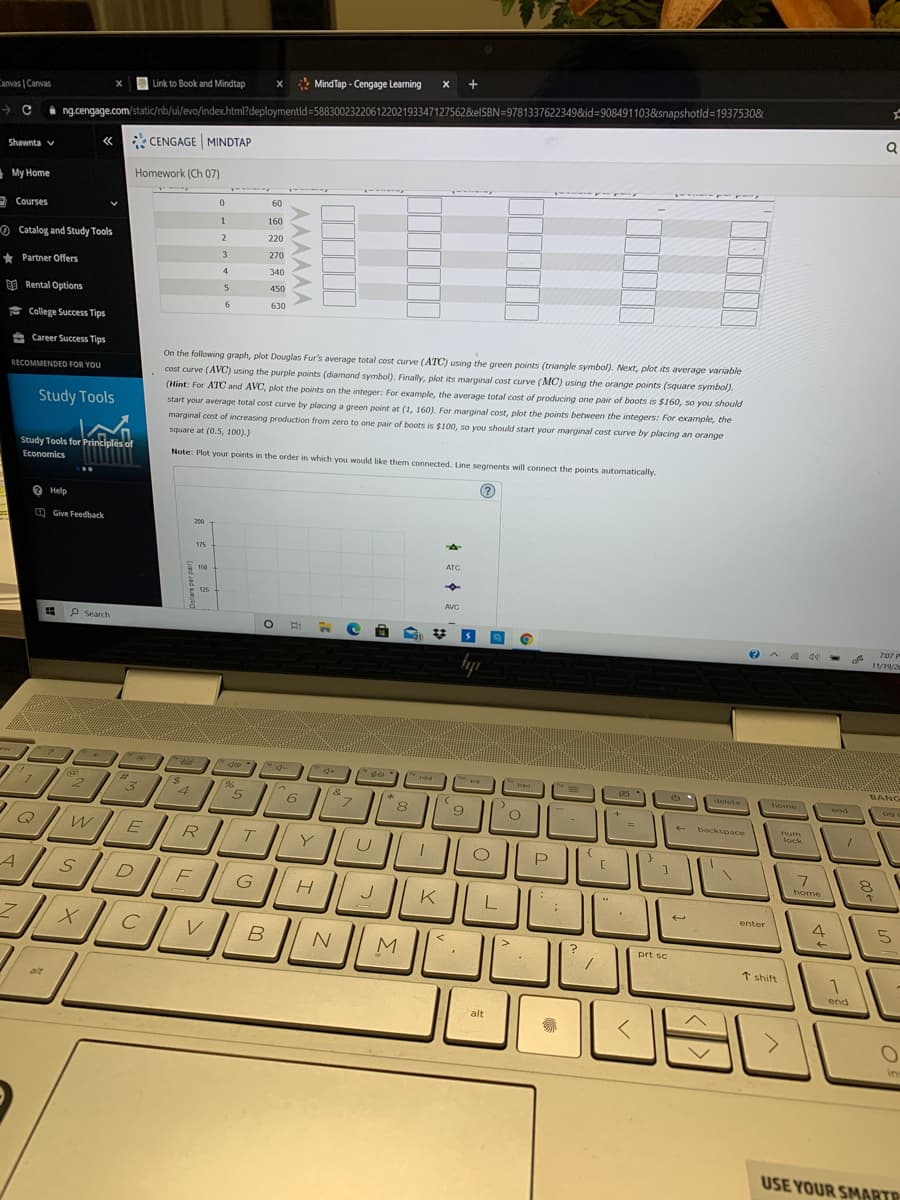
On the following graph, plot Douglas Fur's average total cost curve (ATC) using the green points (triangle symbol). Next, plot its average variable
cost curve (AVC) using the purple points (diamond symbol). Finally, plot its marginal cost curve (MC) using the orange points (square symbol).
(Hint: For ATC and AVC, plot the points on the integer: For example, the average total cost of producing one pair of boots is $160, so you should
start your average total cost curve by placing a green point at (1, 160). For marginal cost, plot the points between the integers: For example, the
marginal cost of increasing production from zero to one pair of boots is $100, so you should start your marginal cost curve by placing an orange
RECOMMENDED FOR YOU
Study Tools
square at (0.5, 100).)
Study Tools for Principles of
Note: Plot your points in the order in which you would like them connected. Line segments will connect the points automatically.
Economics
O Help
O Give Feedback
200
175
ATÇ
150
125
AVC
P Search
707
11/19/2
BANG
%23
3.
pes
%24
4
detete
&
home
end
6.
8
9
backspace
num
lock
E
R
T.
Y
D
home
G
J
K
enter
4
5
prt sc
t shift
1
alt
end
alt
ins
USE YOUR SMARTP
AAAAAA
Expert Solution
This question has been solved!
Explore an expertly crafted, step-by-step solution for a thorough understanding of key concepts.

This is a popular solution!

Trending now
This is a popular solution!

Step by step
Solved in 2 steps with 6 images

Knowledge Booster


Learn more about
Need a deep-dive on the concept behind this application? Look no further. Learn more about this topic, economics and related others by exploring similar questions and additional content below.Recommended textbooks for you
