Drag each graph given below to its corresponding regression equation to the right. 13. y = - 1.361x+21.952 Ay Ay 140- 30- 120- 100- 25- 20- 80- 60- 40- 20- 15 10- 5- 20 30 40 50 10 14. y 2.115x + 21.958 Ay Ay 30- 70- 25 60- 50- 20 40- 15 30- 20- 10- 5- 10- 15. y = 2.125x +9.588 s 10 15 20 25 30 35 40 10 15 20 25 30 16. y = -0.705x +27.214
Drag each graph given below to its corresponding regression equation to the right. 13. y = - 1.361x+21.952 Ay Ay 140- 30- 120- 100- 25- 20- 80- 60- 40- 20- 15 10- 5- 20 30 40 50 10 14. y 2.115x + 21.958 Ay Ay 30- 70- 25 60- 50- 20 40- 15 30- 20- 10- 5- 10- 15. y = 2.125x +9.588 s 10 15 20 25 30 35 40 10 15 20 25 30 16. y = -0.705x +27.214

Chapter6: Exponential And Logarithmic Functions
Section6.8: Fitting Exponential Models To Data
Problem 5SE: What does the y -intercept on the graph of a logistic equation correspond to for a population...

Related questions
Question
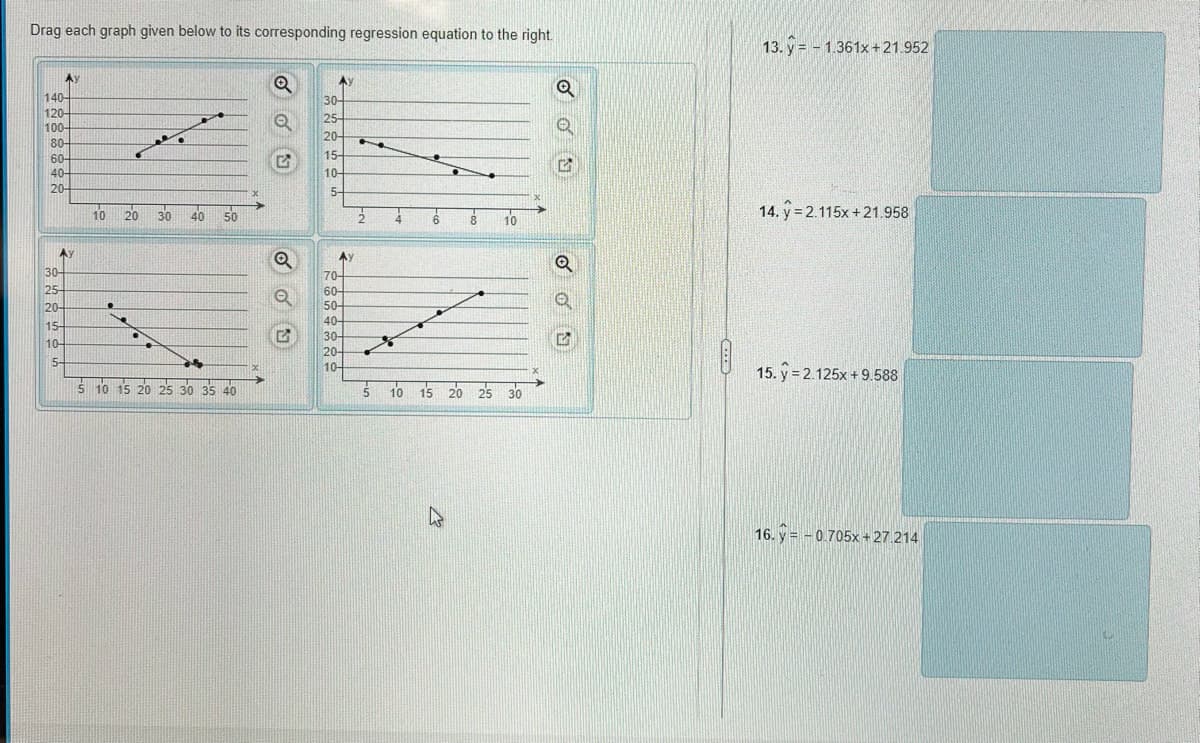
Transcribed Image Text:Drag each graph given below to its corresponding regression equation to the right.
13. y = - 1.361x+21.952
Ay
140-
30-
120-
25
100-
20-
80-
60-
15-
40-
10-
20-
5-
10
20
30 40 50
10
14. y = 2.115x + 21.958
Ay
Ay
30-
70-
25-
60-
50-
20-
40
15-
30
10-
20-
5-
10-
15. y = 2.125x +9.588
s 10 15 20 2s 30 35 40
5 10 15 20 25 30
16. y = -0.705x +27.214
Expert Solution
This question has been solved!
Explore an expertly crafted, step-by-step solution for a thorough understanding of key concepts.

This is a popular solution!

Trending now
This is a popular solution!

Step by step
Solved in 2 steps with 1 images

Recommended textbooks for you

Functions and Change: A Modeling Approach to Coll…
Algebra
ISBN:
9781337111348
Author:
Bruce Crauder, Benny Evans, Alan Noell
Publisher:
Cengage Learning

Algebra & Trigonometry with Analytic Geometry
Algebra
ISBN:
9781133382119
Author:
Swokowski
Publisher:
Cengage
Functions and Change: A Modeling Approach to Coll…
Algebra
ISBN:
9781337111348
Author:
Bruce Crauder, Benny Evans, Alan Noell
Publisher:
Cengage Learning
Algebra & Trigonometry with Analytic Geometry
Algebra
ISBN:
9781133382119
Author:
Swokowski
Publisher:
Cengage

College Algebra
Algebra
ISBN:
9781305115545
Author:
James Stewart, Lothar Redlin, Saleem Watson
Publisher:
Cengage Learning

Algebra and Trigonometry (MindTap Course List)
Algebra
ISBN:
9781305071742
Author:
James Stewart, Lothar Redlin, Saleem Watson
Publisher:
Cengage Learning