Draw a graph slowing the load line for the Thevenin circuit shown in Figure 1-26. On the same graph, show the IV curve for a 150kΩ resistor. Show the Q-input on your plot
Draw a graph slowing the load line for the Thevenin circuit shown in Figure 1-26. On the same graph, show the IV curve for a 150kΩ resistor. Show the Q-input on your plot

Electricity for Refrigeration, Heating, and Air Conditioning (MindTap Course List)
10th Edition
ISBN:9781337399128
Author:Russell E. Smith
Publisher:Russell E. Smith
Chapter5: Components, Symbols, And Circuitry Of Air-conditioning Wiring Diagrams
Section: Chapter Questions
Problem 27RQ: Change the following normally open elements from the de-energized position to the energized...

Related questions

Question
Draw a graph slowing the load line for the Thevenin circuit shown in Figure 1-26. On the same graph, show the IV curve for a 150kΩ resistor. Show the Q-input on your plot.
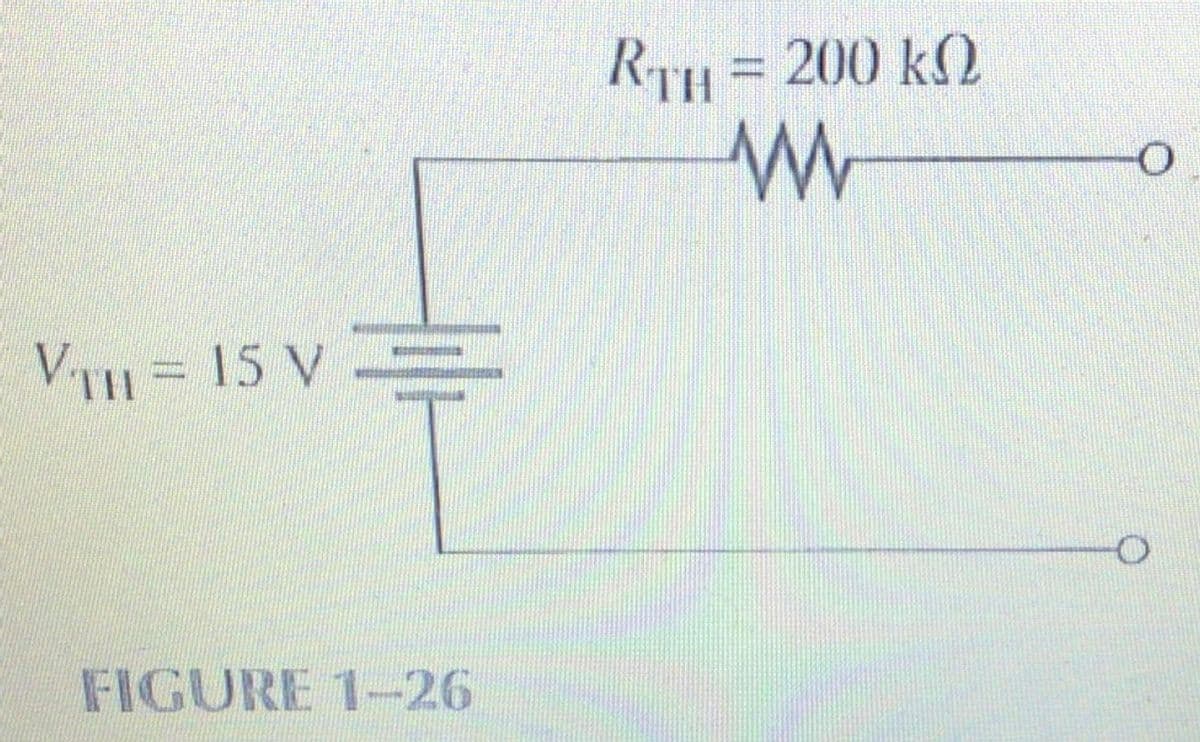
Transcribed Image Text:RTH = 200 k2
VTH = 15 V
FIGURE 1-26
Expert Solution
This question has been solved!
Explore an expertly crafted, step-by-step solution for a thorough understanding of key concepts.

Step by step
Solved in 2 steps with 1 images

Knowledge Booster


Learn more about
Need a deep-dive on the concept behind this application? Look no further. Learn more about this topic, electrical-engineering and related others by exploring similar questions and additional content below.Recommended textbooks for you
Electricity for Refrigeration, Heating, and Air C…
Mechanical Engineering
ISBN:
9781337399128
Author:
Russell E. Smith
Publisher:
Cengage Learning
Electricity for Refrigeration, Heating, and Air C…
Mechanical Engineering
ISBN:
9781337399128
Author:
Russell E. Smith
Publisher:
Cengage Learning