Draw a scatterplot of the right foot temperature (y) versus the left foot temperature (x). Then draw the least-squares regression line on the graph.
Draw a scatterplot of the right foot temperature (y) versus the left foot temperature (x). Then draw the least-squares regression line on the graph.

Glencoe Algebra 1, Student Edition, 9780079039897, 0079039898, 2018
18th Edition
ISBN:9780079039897
Author:Carter
Publisher:Carter
Chapter10: Statistics
Section10.6: Summarizing Categorical Data
Problem 21PPS

Related questions
Question
Draw a scatterplot of the right foot temperature (y) versus the left foot temperature (x). Then draw the least-squares
regression line on the graph.
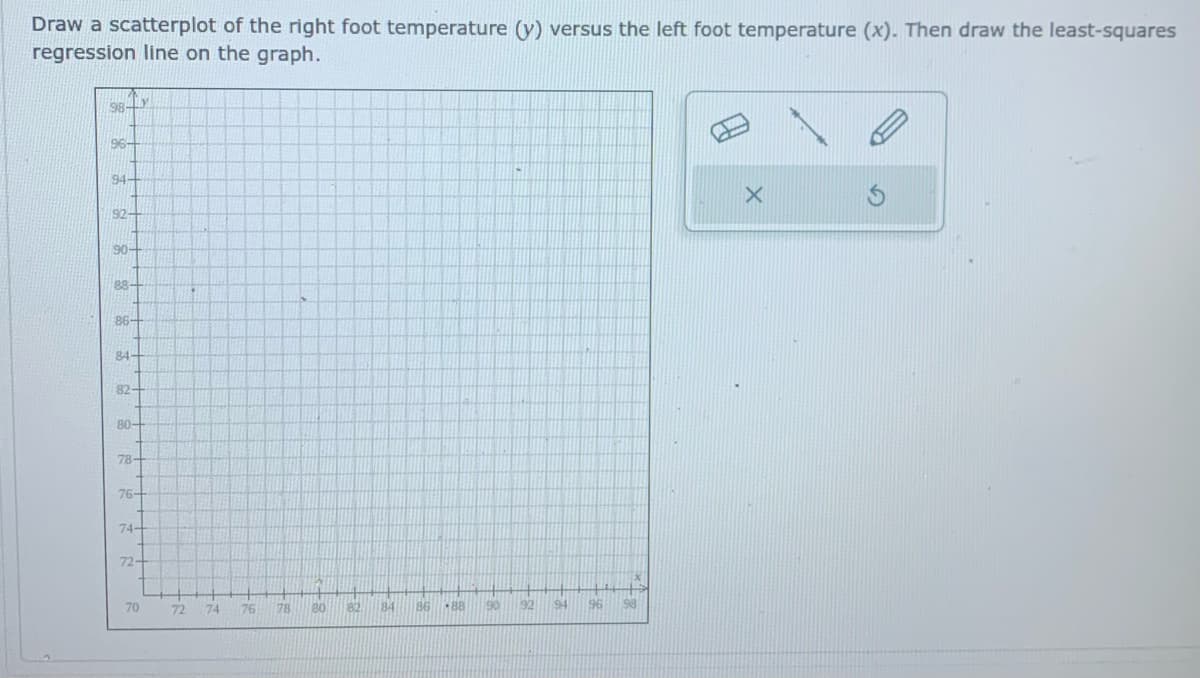
Transcribed Image Text:Draw a scatterplot of the right foot temperature (y) versus the left foot temperature (x). Then draw the least-squares
regression line on the graph.
98-
96-
94-
92-
90-
8-
86-
84-
82-
80-
78-
76-
74-
72-
70
72
74
78
80
82
84
86
90
92
94
96
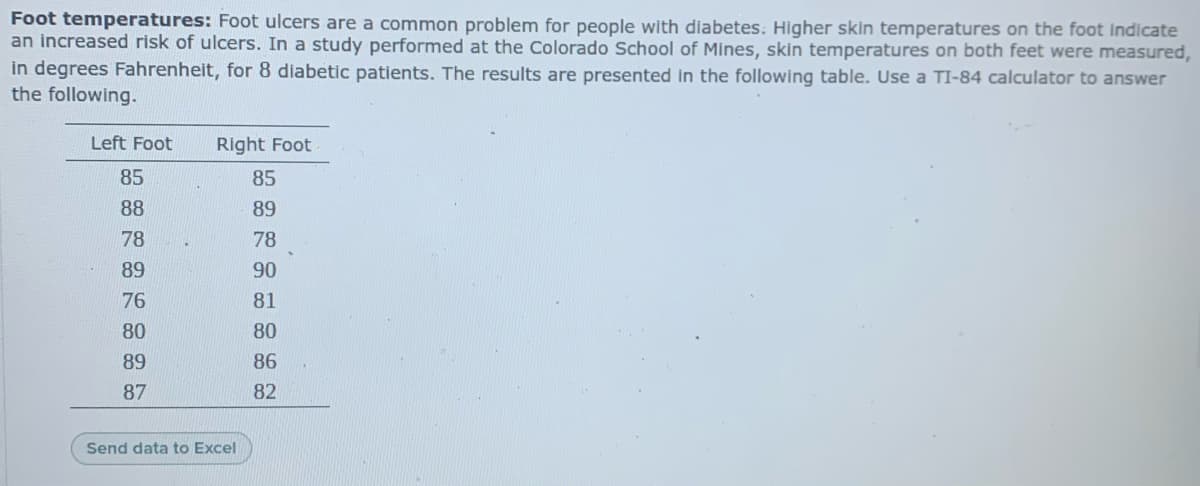
Transcribed Image Text:Foot temperatures: Foot ulcers are a common problem for people with diabetes. Higher skin temperatures on the foot Indicate
an increased risk of ulcers. In a study performed at the Colorado School of Mines, skin temperatures on both feet were measured,
in degrees Fahrenheit, for 8 diabetic patients. The results are presented in the following table. Use a TI-84 calculator to answer
the following.
Left Foot
Right Foot
85
85
88
89
78
78
89
90
76
81
80
80
89
86
87
82
Send data to Excel
Expert Solution
This question has been solved!
Explore an expertly crafted, step-by-step solution for a thorough understanding of key concepts.

This is a popular solution!

Trending now
This is a popular solution!

Step by step
Solved in 2 steps with 1 images

Recommended textbooks for you
Glencoe Algebra 1, Student Edition, 9780079039897…
Algebra
ISBN:
9780079039897
Author:
Carter
Publisher:
McGraw Hill

Holt Mcdougal Larson Pre-algebra: Student Edition…
Algebra
ISBN:
9780547587776
Author:
HOLT MCDOUGAL
Publisher:
HOLT MCDOUGAL
Glencoe Algebra 1, Student Edition, 9780079039897…
Algebra
ISBN:
9780079039897
Author:
Carter
Publisher:
McGraw Hill
Holt Mcdougal Larson Pre-algebra: Student Edition…
Algebra
ISBN:
9780547587776
Author:
HOLT MCDOUGAL
Publisher:
HOLT MCDOUGAL