Draw Box plot. Describe the shape of the distribution, explain your reason. Which measure- the mean or the median- best represents the data. explain your reason.
Draw Box plot. Describe the shape of the distribution, explain your reason. Which measure- the mean or the median- best represents the data. explain your reason.

Algebra & Trigonometry with Analytic Geometry
13th Edition
ISBN:9781133382119
Author:Swokowski
Publisher:Swokowski
Chapter10: Sequences, Series, And Probability
Section10.5: The Binomial Theorem
Problem 11E

Related questions
Question
Draw Box plot.
Describe the shape of the distribution, explain your reason.
Which measure- the
the data. explain your reason.
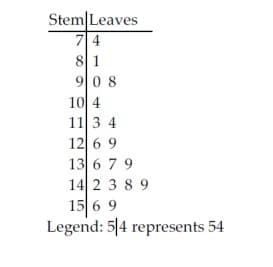
Transcribed Image Text:Stem Leaves
74
81
908
104
11 3 4
12 69
13 6 7 9
1423 89
1569
Legend: 5/4 represents 54
Expert Solution
This question has been solved!
Explore an expertly crafted, step-by-step solution for a thorough understanding of key concepts.

Step by step
Solved in 4 steps with 1 images

Recommended textbooks for you
Algebra & Trigonometry with Analytic Geometry
Algebra
ISBN:
9781133382119
Author:
Swokowski
Publisher:
Cengage

Algebra: Structure And Method, Book 1
Algebra
ISBN:
9780395977224
Author:
Richard G. Brown, Mary P. Dolciani, Robert H. Sorgenfrey, William L. Cole
Publisher:
McDougal Littell
Algebra & Trigonometry with Analytic Geometry
Algebra
ISBN:
9781133382119
Author:
Swokowski
Publisher:
Cengage
Algebra: Structure And Method, Book 1
Algebra
ISBN:
9780395977224
Author:
Richard G. Brown, Mary P. Dolciani, Robert H. Sorgenfrey, William L. Cole
Publisher:
McDougal Littell