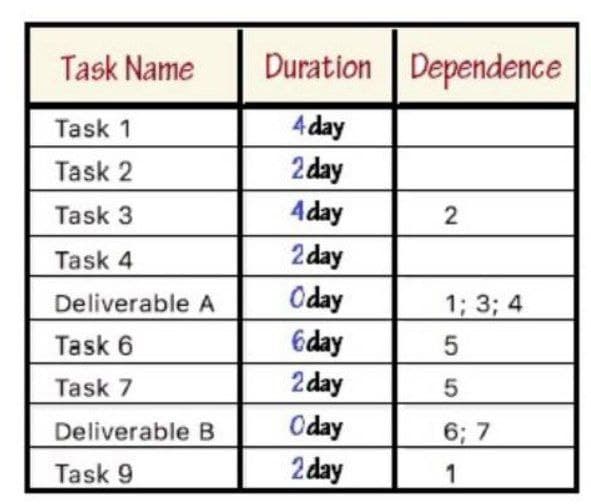
Draw The Gantt Diagram


Q: Question 6. Convert the following CFG into CNF. Show all intermediate steps. A → BAB B& B → 00 | E
A: Please check the step 2 and 3 for cnf conversion.
Q: 1. Convert the diagram to state table. 91 92 93 2. Identify the different parts of the transition…
A: The transition table is basically a tabular representation of the transition function.
Q: What do Venn diagrams display, and why is the information valuable?
A: Venn diagrams A venn diagram is used to show relationship among things or finite groups of things.…
Q: 1. Yi Carry; Sum; Carry:+1
A: The full adder is an adder that takes three inputs and outputs two results. The first two inputs are…
Q: Explain the Clark-Wilson Model
A: Please upvote/like. I am providing you the correct answer below. The Clark-Wilson model is for…
Q: Describe the mechanism of absorption and emission(such as flourescence and phosphorescence)based on…
A: Jablonski diagram is defined as the diagram which describes arranged energy on a vertical axis and…
Q: Please explain how to plot a E-k Kronig-Penney diagram using Excel.
A: Below i have shown:
Q: Define chmod
A: chmond is referred to as a Linux command to change the access permission of a file. It is possible…
Q: ER diagram
A: Given :- In the above given question , an Entity Relationship (ER) diagram showing a Student/…
Q: * Q1 Show in block diagram:( choose one) (A) Simplified view of PLC. (B) Expanded view of PLC.
A: Dear learner , hope you are doing well , I will try my best to answer this question. Thank You !!
Q: Thank you A sequence recognizer for the sequence “010” using Moore FSM make a truth table and…
A: It is defined as a mathematical table used in logic—specifically in connection with Boolean algebra,…
Q: example: ababaaa, babbbb,aaababababaaa, etc. Part(a) Give a NFA for L as a state transition diagram.…
A: The regular expression would be (a+b)*aba(a+b)* + (a+b)*bab(a+b)* + (a+b)*aba(a+b)*bab(a+b)* +…
Q: uestion 2: draw the given diagram using MS Visio. Network Diagram
A: It is defined as a visual representation of a computer or telecommunications network. It shows the…
Q: Explain Moore’s law?
A: The answer is given below:-
Q: 0,1,.9 0,1..9 Start 12 I3 0,1..9, 0,1..9 I4
A: NFA TO DFA CONVERSION: Let there is an NFA N < Q, ∑, q0, δ, F > which recognizes a language…
Q: Briefly explain logical shift
A: Logical shift: It is a bitwise operation which shifts all the bits of its operand. Logical shift…
Q: xplain the seven stages of the Donald Norman’s model in detail
A: It consists of seven stages as follows:User to establish GoalUser to formulate IntentionDecides on…
Q: Question 6. Convert the following CFG into CNF. Show all intermediate steps. A → BAB | B& B → 00 | E
A: Here is the conversion into cnf:
Q: Reduce the state Draw the state diagram Draw ASM chart
A: Given: Reduce the state Draw the state diagram Draw ASM chart Note : As per our guidelines we are…
Q: Convert the following CFG to CNF: AS BS S SB A SA
A: Given:
Q: make the block diagram
A: The above question is solved in step 2:-
Q: Assignment: Explain all ER-D parts
A: Answer: Entity Relationship Diagram (ERD): An Entity Relationship Diagram (ERD) is a visual…
Q: The data in a state table may be seen using a graph.
A: Introduction: The state of the circuit in this model represents the impact of all previous inputs on…
Q: Make the truth table and draw the FSM diagram.
A: Answer is in given below:-
Q: Explain the SUM CRUD model
A: The answer is as follows:-
Q: Briefly define the terms substitution and permutation its role in DES.
A: Data Encryption Standard (DES) The standard is defined as the symmetric-key block cipher created by…
Q: Question no. 2: design Schematic diagram and verify truth table. Of given circuit A B. B Ci Co
A: Let’s begin with a semiconductor gate circuit in need of simplification. The “A,” “B,” and “C” input…
Q: convert this er diagram in the picture to simple plain text.
A: There are so many entities in the above ER diagram. Vehicle Insurance Agent Part…
Q: onstruction of an equivalent CNF for the following CFG. S→ aAD A → aB|bAB B→ b D→ d
A: Solution -- A CFG G, is called to be in {CNF} Chomsky normal form if all of its production rules…
Q: the machine given in the figure has state diagram as
A: For the machine given in the figure has state diagram as
Q: Design a ladder diagram to implement the control function based on the following truth table: c)…
A:
Q: Select a system and construct a P-diagram by including inputs, outputs, control factors, and noise…
A: Explanation: While arranging for something like the System or Sub-system FMEA, a P-Diagram would…
Q: Explain with a block diagram how interfacing is achieved using ADC AND DAC.
A: Given: . Explain with a block diagram how interfacing is achieved using ADC AND DAC.
Q: premises
A: Robust optimization is a paradigm that employs concepts from convexity and duality to inoculate…
Q: Given the truth table below, provide the output equations and Diagram
A:
Q: 2- The following diagram is equivalent to the function of: а) ХOR b) XNOR c) NAND d) None of the…
A: Defined the given diagram is equivalent to the function
Q: Explain UML Timing diagram with example
A: Lets see the solution.
Q: FPGA is an integrated circuit which is designed to be configured by the end users after being…
A: Lets understand the meaning of field programmable. Any electronic device whose firmware, such as…
Q: Using said principles (st
A: Step 1: first we take an alphanumeric string as a password.Step 2: first check that this string…
Q: For the system of an air condition draw the following three using Microsoft Visio: The…
A: Air conditioner block diagram:
Q: Define the term " puts " .
A: Answer : In business field , for busniess man , Put is an option under which the owner can sell the…
Q: PLEASE SIMPLIFY THIS BOOLEAN ALGEBRA AND MAKE LOGICAL DIAGRAM y = A'C' + B'C'D + BC'D' + A'BD +…
A: Given Boolean expression is y = A'C' + B'C'D + BC'D' + A'BD + ACD' It has total five input symbols…
Q: How is Rock’s Law related to Moore’s Law?
A: Relation of Rock's law to Moore's law The density of a transistor doubles each year in an…
Q: Want EER DIAGRAM
A: Given :- I need Entity Relationship Diagram (EER diagram) of Examination Hall Ticket Management…
Q: 1. Two DFA are given below. Find the product table and list the states that are accepted by the…
A:
Q: Draw the following diagrams: 1. Use case diagram
A: The given problem is related to creating the UML diagrams for the given case study for the online…
Q: Describe in detail the seven steps of Donald Norman's model.
A: Introduction: Norman employs the model to illustrate why some user interfaces generate issues. "Gulf…
Q: Draw truth table , Circuit Diagram & final equation
A: Truth table: A B A⊕B (A⊕B)' 0 0 0 1 0 1 1 0 1 0 1 0 1 1 0 1

Step by step
Solved in 2 steps with 1 images

- There are different types of CRM - (Select the incorrect answer) a. Collaborative CRM b. Predictive CRM c. Analytical CRM d. Operational CRMfollowing diagram explanation Task A, duration 2, no dependencyTask B, duration 4, no dependencyTask C, duration 7, no dependencyTask D, duration 5, depends on Task ATask E, duration 3, depends on Task B and Task CTask F, duration 8, depends on Task CTask G, duration 10, depends on Task D and Task ETask H, duration 4, depends on Task ETask I, duration 7, depends on Task FTask J, duration 12, depends on Task H and Task I So Question isUsing the diagram you created in question 5, calculate ES, EF, LS, and LF for each task and the amount of slack. (Refer to Figure 6-8 for an example.) List the tasks that appear on the critical path.Following Diagram explaination is Task A, duration 2, no dependencyTask B, duration 4, no dependencyTask C, duration 7, no dependencyTask D, duration 5, depends on Task ATask E, duration 3, depends on Task B and Task CTask F, duration 8, depends on Task CTask G, duration 10, depends on Task D and Task ETask H, duration 4, depends on Task ETask I, duration 7, depends on Task FTask J, duration 12, depends on Task H and Task I Question is What happens to the critical path in the network schedule created in question 5 if the duration of Task E changes to 11 days?
- Following Diagram explaination is Task A, duration 2, no dependencyTask B, duration 4, no dependencyTask C, duration 7, no dependencyTask D, duration 5, depends on Task ATask E, duration 3, depends on Task B and Task CTask F, duration 8, depends on Task CTask G, duration 10, depends on Task D and Task ETask H, duration 4, depends on Task ETask I, duration 7, depends on Task FTask J, duration 12, depends on Task H and Task I The question is Create a spreadsheet similar to Table 6-1 and find the number of function points for the following application description:User inputs = Low complexity = 25, Mediumcomplexity = 5, High complexity = 2User outputs = Low complexity = 30, Mediumcomplexity = 10, High complexity = 1Files/structures = Low complexity = 50, Mediumcomplexity = 8, High complexity = 5User inquiries = Low complexity = 15, Mediumcomplexity = 2, High complexity = 2External interfaces = Low complexity = 25,Medium complexity = 10, High complexity = 3Use a VAF of 42Create an AOA diagram based on the following information Task A, duration 2, no dependencyTask B, duration 4, no dependencyTask C, duration 7, no dependencyTask D, duration 5, depends on Task ATask E, duration 3, depends on Task B and Task CTask F, duration 8, depends on Task CTask G, duration 10, depends on Task D and Task ETask H, duration 4, depends on Task ETask I, duration 7, depends on Task FTask J, duration 12, depends on Task H and Task IThe LMS (learning management system) has six processes and three data stores. Process/Data Store Incoming Data Flows Outgoing Data Flows 1.0 Set up Tests SOURCE TEST DATA TEST QUESTIONS 2.0 Set up Gradebook CLASS ROSTER, GRADING PARAMETERS, TEST SCORING CLASS GRADEBOOK 3.0 Place on Timeline NEW ASSIGNMENT SCHEDULED ASSIGNMENT 4.0 Access Timeline DOWNLOAD, HW & CLASSWORK UPLOAD 5.0 Grade Assignments STUDENT ASSIGNMENT RELEASED GRADE 6.0 Check Grades LATEST GRADES GRADE REPORT D1 Tests TEST QUESTIONS TEST SCORING D2 Gradebook CLASS GRADEBOOK, RELEASED GRADE LATEST GRADES D3 Assignments SCHEDULED ASSIGNMENT, UPLOAD DOWNLOAD, STUDENT ASSIGNMENT Draw a DFD Level-0 diagram for the LMS using diagram.net .
- Construct a Performance Evaluation and Audit Sequence (PEAS) for the robotic soccer player's task setting.Differentiate between normalizing and standardizing. Explain your response by providing specific instances.Computer Science THREE TABLES: 1. PROJECT WORKER_TABLE COLUMNS leavedate, worker_id, joindate, project_id, performance 2. PROJECTS TABLE COLUMNS projectid, project_name, capacity, startdate 3. WORKERS table COLUMNS worker_id, worker_name, gender, companyjoindate, birthdate, birthday, supervisory_id USE MYSQL TO ANSWER QUESTION BELOW Q: Find the ID and name of the project(s) that have a gender ratio of greater than one[Gender ratio = #of females/# of males]
- 192. In the maintenance phase the product must be tested against previous test cases. This is known as __________ testing. a. Unit b. Regression c. Acceptance d. IntegrationDraw UML Activity Diagram for the below given steps for student’s registration operations. Check Transcript If status is under probation Meet advisor Register for courses If status is normal load Register online Attend the classes regularly Parallel to classes attend co-curricular activities Attend exam at the end of semesterDraw a activity digram for a hospital diagnosis system with ( view medical history/ perform test / retrieve results/ track progress and generate report) as activitys
