() Draw the project network. (i) Find the expected duration and variance for each activity. (ii) What is the expected project length and standard deviation? (iv) What is the probability that the project will be completed 3 weeks later than the expected time?
() Draw the project network. (i) Find the expected duration and variance for each activity. (ii) What is the expected project length and standard deviation? (iv) What is the probability that the project will be completed 3 weeks later than the expected time?

Principles of Heat Transfer (Activate Learning with these NEW titles from Engineering!)
8th Edition
ISBN:9781305387102
Author:Kreith, Frank; Manglik, Raj M.
Publisher:Kreith, Frank; Manglik, Raj M.
Chapter5: Analysis Of Convection Heat Transfer
Section: Chapter Questions
Problem 5.18P: The drag on an airplane wing in flight is known to be a function of the density of air (), the...

Related questions
Question
100%
i want correct answer or dont attempt
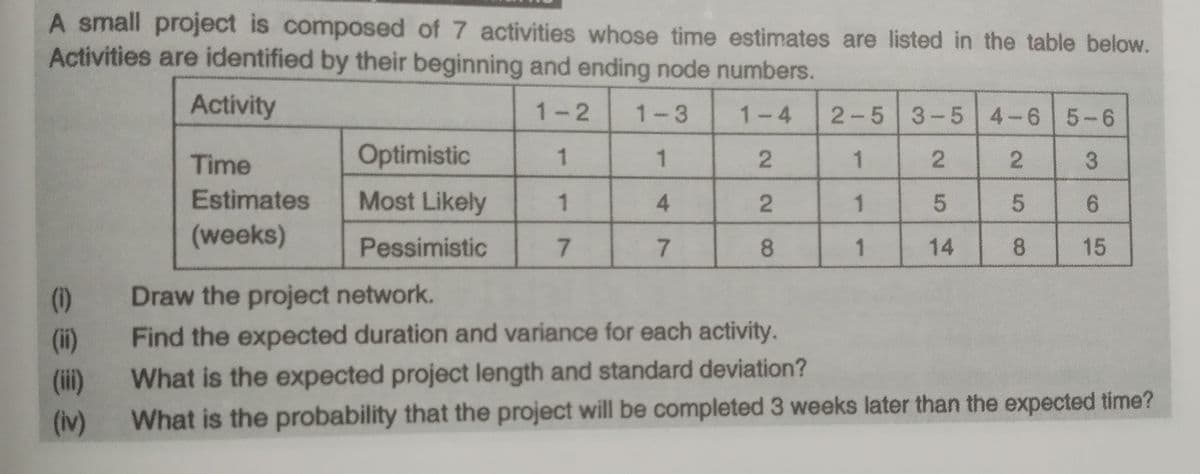
Transcribed Image Text:A small project is composed of 7 activities whose time estimates are listed in the table below.
Activities are identified by their beginning and ending node numbers.
Activity
1-2
1-3
1-4
2-5 3-5 4-6 5-6
Time
Optimistic
1
3
Estimates
Most Likely
1
4.
1
6.
(weeks)
Pessimistic
7.
7.
1
14
8
15
(1)
Draw the project network.
(i)
Find the expected duration and variance for each activity.
(ii)
What is the expected project length and standard deviation?
(iv)
What is the probability that the project will be completed 3 weeks later than the expected time?
2.
2.
1-
22
8.
1.
Expert Solution
This question has been solved!
Explore an expertly crafted, step-by-step solution for a thorough understanding of key concepts.

Step by step
Solved in 2 steps with 2 images

Recommended textbooks for you
Principles of Heat Transfer (Activate Learning wi…
Mechanical Engineering
ISBN:
9781305387102
Author:
Kreith, Frank; Manglik, Raj M.
Publisher:
Cengage Learning
Principles of Heat Transfer (Activate Learning wi…
Mechanical Engineering
ISBN:
9781305387102
Author:
Kreith, Frank; Manglik, Raj M.
Publisher:
Cengage Learning