During a snowstorm, Noah tracked the amount of snow on the ground. When the storm began, there was 1 inch of snow on the ground. For the first 4 hours of the storm, snow fell at a constant rate of 3 inches per hour. The storm then stopped for 2 hours and then started again at a constant rate of 2 inches per hour for the next 6 hours. Make a graph showing the inches of snow on the ground over time using the data that Noah collected.
During a snowstorm, Noah tracked the amount of snow on the ground. When the storm began, there was 1 inch of snow on the ground. For the first 4 hours of the storm, snow fell at a constant rate of 3 inches per hour. The storm then stopped for 2 hours and then started again at a constant rate of 2 inches per hour for the next 6 hours. Make a graph showing the inches of snow on the ground over time using the data that Noah collected.

Algebra & Trigonometry with Analytic Geometry
13th Edition
ISBN:9781133382119
Author:Swokowski
Publisher:Swokowski
Chapter3: Functions And Graphs
Section3.3: Lines
Problem 58E

Related questions

Concept explainers
Equations and Inequations
Equations and inequalities describe the relationship between two mathematical expressions.
Linear Functions
A linear function can just be a constant, or it can be the constant multiplied with the variable like x or y. If the variables are of the form, x2, x1/2 or y2 it is not linear. The exponent over the variables should always be 1.
Question
During a snowstorm, Noah tracked the amount of snow on the ground. When the storm began, there was 1 inch of snow on the ground. For the first 4 hours of the storm, snow fell at a constant rate of 3 inches per hour. The storm then stopped for 2 hours and then started again at a constant rate of 2 inches per hour for the next 6 hours. Make a graph showing the inches of snow on the ground over time using the data that Noah collected.
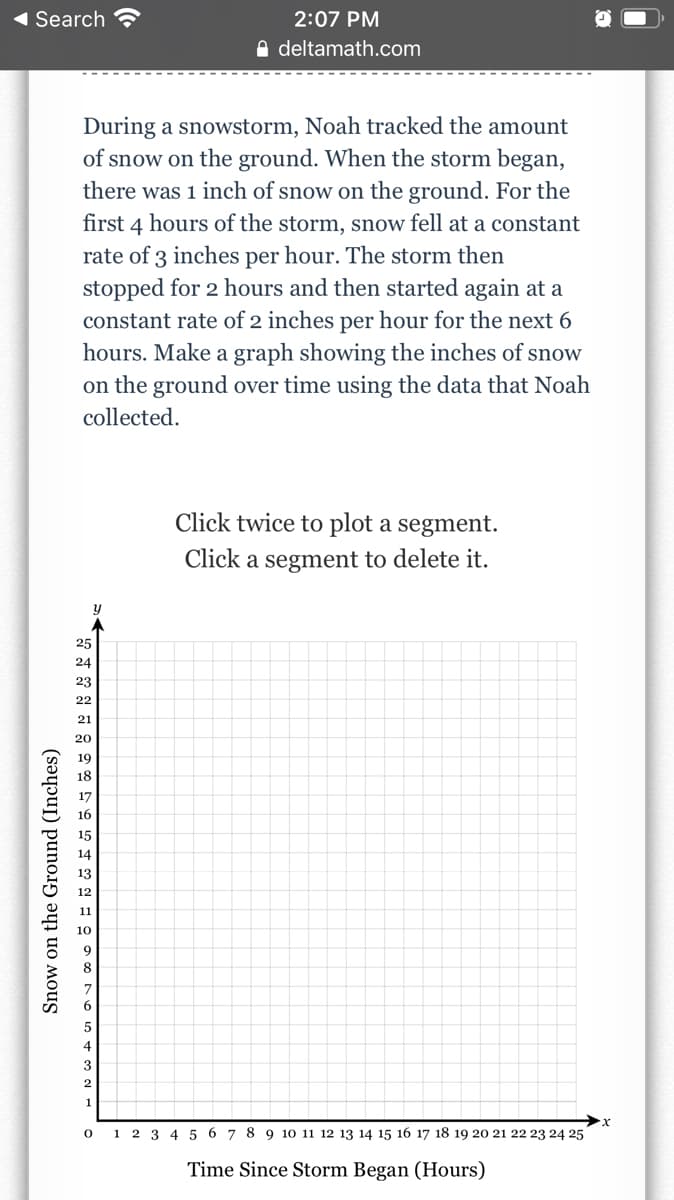
Transcribed Image Text:Search ?
2:07 PM
A deltamath.com
During a snowstorm, Noah tracked the amount
of snow on the ground. When the storm began,
there was 1 inch of snow on the ground. For the
first 4 hours of the storm, snow fell at a constant
rate of 3 inches per hour. The storm then
stopped for 2 hours and then started again at a
constant rate of 2 inches per hour for the next 6
hours. Make a graph showing the inches of snow
on the ground over time using the data that Noah
collected.
Click twice to plot a segment.
Click a segment to delete it.
25
24
23
22
21
20
19
18
17
16
15
4
3
2
1
1 2 3 4 5 6 7 89 1o 11 12 13 14 15 16 17 18 19 20 21 22 23 24 25
Time Since Storm Began (Hours)
Snow on the Ground (Inches)
Expert Solution
This question has been solved!
Explore an expertly crafted, step-by-step solution for a thorough understanding of key concepts.

This is a popular solution!

Trending now
This is a popular solution!

Step by step
Solved in 2 steps with 1 images

Knowledge Booster


Learn more about
Need a deep-dive on the concept behind this application? Look no further. Learn more about this topic, algebra and related others by exploring similar questions and additional content below.Recommended textbooks for you
Algebra & Trigonometry with Analytic Geometry
Algebra
ISBN:
9781133382119
Author:
Swokowski
Publisher:
Cengage

College Algebra (MindTap Course List)
Algebra
ISBN:
9781305652231
Author:
R. David Gustafson, Jeff Hughes
Publisher:
Cengage Learning

Functions and Change: A Modeling Approach to Coll…
Algebra
ISBN:
9781337111348
Author:
Bruce Crauder, Benny Evans, Alan Noell
Publisher:
Cengage Learning
Algebra & Trigonometry with Analytic Geometry
Algebra
ISBN:
9781133382119
Author:
Swokowski
Publisher:
Cengage
College Algebra (MindTap Course List)
Algebra
ISBN:
9781305652231
Author:
R. David Gustafson, Jeff Hughes
Publisher:
Cengage Learning
Functions and Change: A Modeling Approach to Coll…
Algebra
ISBN:
9781337111348
Author:
Bruce Crauder, Benny Evans, Alan Noell
Publisher:
Cengage Learning

Glencoe Algebra 1, Student Edition, 9780079039897…
Algebra
ISBN:
9780079039897
Author:
Carter
Publisher:
McGraw Hill

College Algebra
Algebra
ISBN:
9781305115545
Author:
James Stewart, Lothar Redlin, Saleem Watson
Publisher:
Cengage Learning
