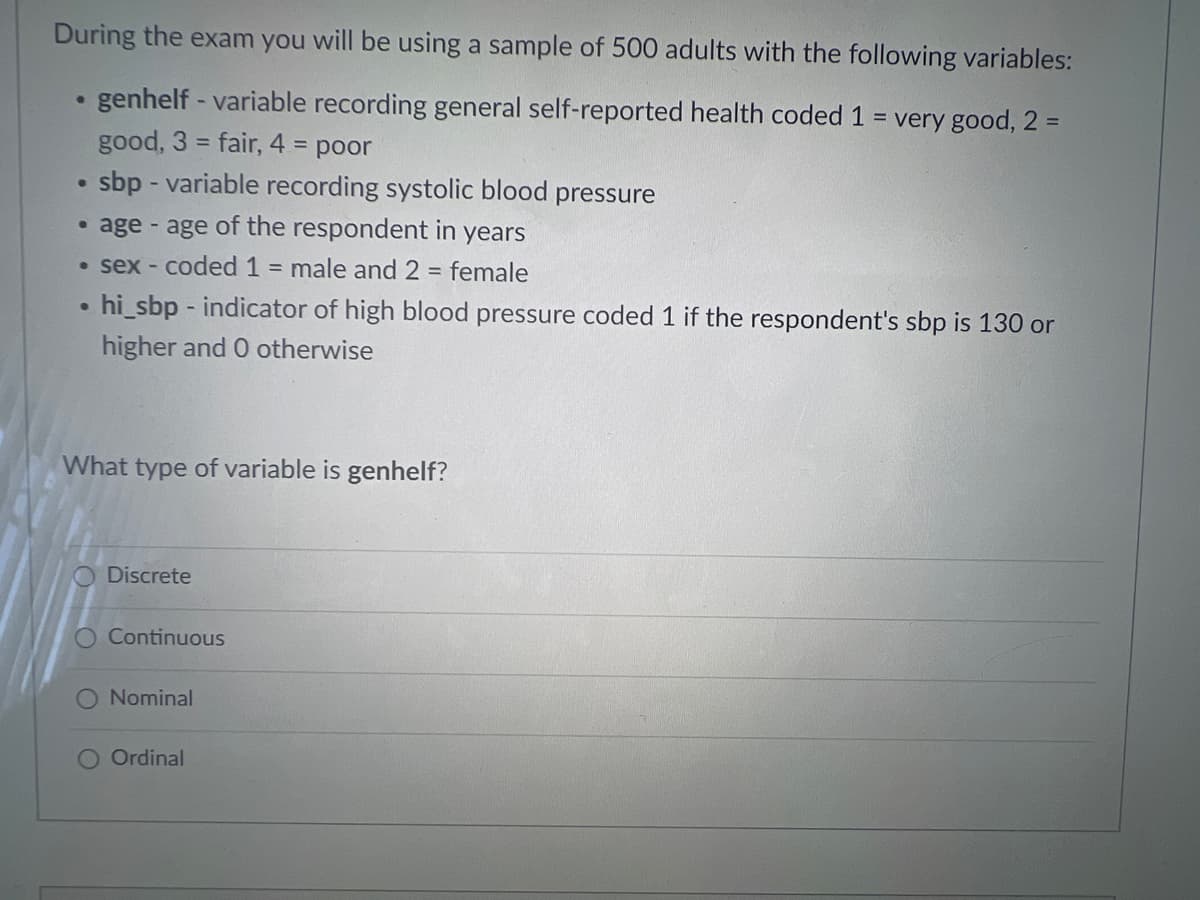
During the exam you will be using a sample of 500 adults with the following variables: ● genhelf - variable recording general self-reported health coded 1 = very good, 2 = good, 3 = fair, 4 = poor ● sbp - variable recording systolic blood pressure age - age of the respondent in years • sex - coded 1 = male and 2 = female ● hi_sbp - indicator of high blood pressure coded 1 if the respondent's sbp is 130 or higher and 0 otherwise What type of variable is genhelf?


Q: Use z scores to compare the given values. The tallest living man at one time had a height of 246 cm.…
A: Given that. X~N( μ , ?^2 ) μ=170.86 , ?=8.41 Z-score =( x - μ )/?
Q: Olivia sees that in her data there is a relationship between regular exercise and a range of health…
A: Solution Given range of health and regular exercise are significantly related.
Q: 1 2 3 4 5 6 7 8 9 10 11 12 2 6,2 1, 5, 2,7 7,8,4 2,5 3,6 2 6 where 7 | 2 = 72 students Calculate the…
A: Solution-: We have get following data from the stem-and-leaf plot: xi:…
Q: You work in admissions for an Intensive English Program. The program claims that its students score…
A: Given: No. Of students =26 Mean score=83.9 Standard deviation =20 Note :As per guidelines of…
Q: A variable measured the type of exercises a person participates in, the variable has the following…
A: Explanation:
Q: Q2) Life of a battery in hours is known to be approximately normally distributed with standard…
A: The question is about hypo. testing Given : Pop. std. deviation of life of battery ( σ ) = 1.25…
Q: Following is a pie chart that presents the percentages of video games sold in each of four rating…
A:
Q: Assume that a sample is used to estimate a population proportion p. Find the 99.5% confidence…
A:
Q: The table below describes a sample of males and females who like and dislike pizza. Give answers to…
A: a) The contingency table is given as follows: Gender Likes pizza Dislike pizza Total…
Q: You may need to use the appropriate technology to answer this question. Data were collected on the…
A: given data
Q: Three people are running for president in a certain school organization. If there are 508 voters,…
A: Number of voters = 508
Q: Question 2 The head teacher of the New Wings Secondary School ask the Math HOD whether the…
A: Normal Distribution: The normal distribution is a balanced distribution function around its mean,…
Q: Assume that a sample is used to estimate a population mean p. Use the given confidence level and…
A: From the provided information, Sample size (n) = 51 Sample mean (x̄) = 97 Standard deviation (s) =…
Q: The average math SAT score is 523 with a standard deviation of 118 A particular high school claims…
A: Given that The average math SAT score is 523 with a standard deviation of 118. Mean (μ) = 523…
Q: Q5) If the following data set obey equation, i.e. y=a+bx linear regression x 3 4 5 9 11 y 42 38 31…
A: Solution-: We want to find linear regression equation and the predicted value of Y if X=12.5?
Q: The Pew Research Center polled a sample of American adults asking how much discrimination they…
A:
Q: There is a claim that the mean annual turnover rate of bottle of B Aspirin is 12. It is suspected…
A: The provided information is n=64x¯=14s=8α=0.07 a.The null and altenative hypothesis is…
Q: Class Interval 96 - 100 91 - 95 86 - 90 81-85 76 - 80 71-75 66-70 Lower Boundaries (LB) 95.5 90.5…
A: The data is as follows Class Interval Lower Boundaries Frequency Less than cumulative frequency…
Q: a) Identify and describe each of the indicated dependencies.
A: A1 →A2 represents a partial dependency, because A2 depends only on A1, rather than on the entire…
Q: following: In September 1996, 33% of adult Americans believed in haunted houses. In a Gallup Poll…
A:
Q: Construct a relative frequency distribution. Round your answers to three decimal places. Game…
A: The number of values corresponding to a class or observation is defined as the frequency of that…
Q: grade was 74 and the standard deviation was 12. She received a grade of 72 on her biology exam,…
A: The question is about z score Given : No. of scores received in Statistics exam ( x1 ) = 82 Mean of…
Q: In a factory manufacturing electronic components there are four machine operators and five machines…
A: First we state the hypothesis for the above question. H01 : There is no difference between…
Q: If n = 310 and X = 248, construct a 99% confidence interval for the population proportion, p. Give…
A: According to the given information in this question We need to find the 99% confidence interval
Q: d) For the following data (80, 40, 62, 70, 30, 82), the standard deviation is 24 O 24.5 O 25 O 25.5…
A:
Q: Let S(x) = "x is a student at Leeward Community College"; F(x) = “x is a faculty member at Leeward…
A:
Q: You want to obtain a sample to estimate how much parents spend on their kids birthday parties. Based…
A:
Q: 4. The mean score on SAT Math Reasoning is 518. A test preparation company claims that the mean…
A:
Q: Oropharyngeal cancer is a disease in which malignant (cancer) cells form in the tissues of the…
A: The objective is to compute for the sensitivity of p16 IHC in diagnosis of oropharyngeal carcinoma.
Q: high, extremely low, or in the typical range. Match them accordingly! North Carolina: µ = 20, o =…
A: It is given that For North Carolina μ = 20, σ = 10.1 For California μ = 80, σ = 20.5 For…
Q: The heights (in cm) and weights (in kg) of thirteen male and ten female students are given below:…
A: * SOLUTION :- Given that ,
Q: The average cost to rent a single-family home in Sebastian is $1,887 per month. Assume that the…
A: From the information we find the probability.
Q: A banker finds that the number of times people use automated-teller machines (ATMs) in a year are…
A: Solution-: Given:μ=40,σ=11.2 We want to find the proportion of customers who use ATMs between 30…
Q: An environmental group took a sample from a river under study to check on the biochemical oxygen…
A:
Q: RST M 0.09 0.25 0.19 N 0.31 0.16 0.00 1. P (R) = 2. P (S) 3. P (RNS) =
A: Given P(R)=0.40 P(S)=0.41
Q: In the following data, where the highest possible score is 10. If the population standard deviation…
A: Solution: Given information: n= 30 Sample size x = ∑xn=18830=6.2667 Sample mean σ= 1.9 Population…
Q: A sample consists of the following n = 6 scores: -2, 7, 6, 4, 1, 3 What is the mean? M = 3.17 What…
A: Solution-: Given data: -2,7,6,4,3,1 We want to find (a) Mean (M)=? (b) The standard deviation (s)…
Q: 2. Based on the Excel output below, find the SSA, degrees of freedom of the error and treatment, and…
A: The question is about ANOVA Given :
Q: Q2) a ball is drawn randomly from a box containing 4, 5, and 4 red, blue, :and white balls…
A:
Q: The mean gasoline consumption of 20 cars is 45 liters with standard deviation of 3 liters, and 95%…
A: The provided information is x¯=45n=20σ=3α=0.051.The point estimate of the population mean µ is b.45…
Q: 12. The sign of the alternative hypothesis in a right-tailed test is always A. equal B. not equal C.…
A: “Since you have asked multiple questions, we will solve the first question for you. If you want any…
Q: utsourcing Company and Technica Global Services has better ustomer service, an independent survey…
A:
Q: Statistical Inferences:Question 6 The heights of juniors at a certain high school have a mean of…
A: Given Mean=65.5 Standard deviations=3.5
Q: The owner of a convenience store has determined that their daily revenue has mean $7,200 and…
A:
Q: Eight schoolchildren, chosen at random from the first year of a large school, were given, without…
A:
Q: 2. Suppose the PDF of X is given by fx(x) = 5e-5x(o)(x). Find its CDF.
A: Solution
Q: Describe three univariate statistics. Use relevant examples to illustrate your comprehension of…
A: Univariate analysis explores each variable in a data set, separately. It looks at the range of…
Q: Suppose Table 3b gives us the IQ range and the possible occupation employment, find out what…
A: Given that: 132 128 106 96 104 99 115 112 90 95 127 113 103 96 101 104 90 127 103 106 122 109…
Q: A marketing research survey shows that approximately 80% of the car owners surveyed indicated that…
A: Hello. Since your question has multiple, we will solve first question for you. If you want remaining…
Q: ose you were given the following data for a section of STAT 210 with 126 enrolled students: 63 26 47…
A: From the given information we want to find correct Option.

Step by step
Solved in 2 steps

- People often wait till middle age to worry about having a healthy heart. However, recent studies have shown that earlier monitoring of risk factors such as blood pressure can be very beneficial (The Wall Street Journal, January 10, 2012). Having higher than normal blood pressure, a condition known as hypertension, is a major risk factor for heart disease. Suppose a large sample of individuals of various ages and gender was selected and that each individual’s blood pressure was measured to determine if they have hypertension. For the sample data, the following table shows the percentage of individuals with hypertension. Develop a side-by-side bar chart with age on the horizontal axis, the percentage of individuals with hypertension on the vertical axis, and side-by-side bars based on gender. What does the display you developed in part (a), indicate about hypertension and age? Comment on differences in gender. Age Male Female 20 - 34 11.0% 9.0% 35 – 44…A recent company survey found that employees who were regular participants in the company fitness program had fewer sick days compared to employees who did not participate. However, because this study was not a true experiment, a cause-and-effect relationship between regular exercise and fewer sick days cannot be determined. Identify a confounding variable that might explain the relationship between regular exercise and fewer sick days that was found by the company survey. Describe a between-subjects design that you could use to determine whether participation in the exercise program caused fewer sick days. What factors would you control for (don’t forget about the confounding variable you previously identified!)? How would a repeated measures (within-subjects) design be different, and would it be appropriate for answering this research question? Why or why not?In a study, the researchers found that there is a strong positive correlation between the number of hours of sleep a person gets and their level of productivity at work. However, they also found that there is a significant difference in the correlation between men and women. How can the researchers test the hypothesis that the correlation between sleep and productivity is different for men and women? What statistical test should they use?
- In 2007, a university study was published investigating the crash risk of alcohol impaired driving. Data from 2,871 crashes were used to measure the association of a person’s blood alcohol level (BAC) with the risk of being in an accident. The table below shows results from the study. The relative risk is a measure of how many times more likely a person is to crash. So, for example, a person with a BAC of 0.09 is 3.54 times as likely to crash as a person who has not been drinking alcohol. BAC 0 .01 .03 .05 .07 .09 .11 .13 .15 .17 .19 .21 risk 1 1.03 1.06 1.38 2.09 3.54 6.41 12.6 22.1 39.05 65.32 99.78 a. Find the best fit exponential model for the risk of having an accident based on your BAC. b. Use your model to predict the relative risk of having an accident for a person with a BAC of 0.08 which is the legal limit in…Guéguen and Jacob (2012) asked waitresses to wear different colored T-shirts on differentdays for a six-week period and recorded the lips left by male customers. The results show that male customers gave significantly bigger tips to waitresses when they were wearing red. For this study, identify the independent variable and the dependent variable.Report the correlations between the three independent variables (age, educ and Protestant) and your dependent variable (childs). Which category had the correlation that was the weakest?
- It has been hypothesized that allergies result from a lack of early childhood exposure to antigens. If this hypothesis were true, then we would expect allergies to be more common in very hygienic households with low levels of bacteria and other infectious agents. To test this theory, researchers at the University of Colorado sampled the houses of 61 children 9-24 months old and recorded two variables: (1) whether the child tested positive for allergies and (2) the concentration of bacterial endotoxin in the house dust (endotoxin units per ml, EU/ml)1. The following are the endotoxin levels at the homes of the 51 children tested negative for allergies. 708.23 911.60 976.81 1316.63 262.74 9772.08 370.76 229.16 2570.51891.19 3163.20 1777.65 1288.57 436.23 2631.63 1173.52 911.67 7942.42 740.32 356.92 1175.48 1480.55 2754.61 575.62 573.89 468.26 1000.71 364.22 1025.26 1022.04 645.41 363.57 977.47 1022.75 1860.63 371.13 174.73 399.68 1479.77 2882.96…The US Department of Housing and Urban Development continues to try to reduce crime rates in public housing projects. Data are available for many variables, including age, income, unemployment, etc. What test could be used to determine whether any of these factors are associated with crime rates?Several epidemiologists conducted a cohort study of the effect of mercury exposure on the development of brain cancer. Subjects were followed for ten years. There were a total of 150,000 people in the study. Among the subjects, 76,000 were exposed to mercury and the rest were not. 52,000 of those exposed to mercury developed brain cancer, and only 1,200 of those unexposed to mercury developed brain cancer. Please create a two-by-two table. Calculate the relative risk and interpret it in a sentence. Calculate the attributable risk and interpret. Calculate the percent attributable risk and interpret. Assume that 30% of people in Rhode Island are exposed to mercury, calculate and interpret the population attributable risk and calculate and interpret the percent population attributable risk.
- In a study of 301 Hispanic women living in San Antonia, Texas, one variable of interest was the percentage of subjects with impaired fasting glucose (IFG). IFG refers to a metabolic stage intermediate between normal glucose homeostasis and diabetes. In the study, 24 women were classified in the IFG stage. The article cites population estimates for IFG among Hispanic women in Texas as 6.3%. Is there sufficient evidence to indicate the population of Hispanic women in San Antonio has a prevalence of IFG higher than 6.3%? Use 95% confidence level and the p -value method to form your conclusion. The computed z score was 1.193. Find the p-value.In a study of 301 Hispanic women living in San Antonia, Texas, one variable of interest was the percentage of subjects with impaired fasting glucose (IFG). IFG refers to a metabolic stage intermediate between normal glucose homeostasis and diabetes. In the study, 24 women were classified in the IFG stage. The article cites population estimates for IFG among Hispanic women in Texas as 6.3%. Is there sufficient evidence to indicate the population of Hispanic women in San Antonio has a prevalence of IFG higher than 6.3%? Use 95% confidence level and the p -value method to form your conclusion. Answer the problem in a complete sentence.In a study of 301 Hispanic women living in San Antonia, Texas, one variable of interest was the percentage of subjects with impaired fasting glucose (IFG). IFG refers to a metabolic stage intermediate between normal glucose homeostasis and diabetes. In the study, 24 women were classified in the IFG stage. The article cites population estimates for IFG among Hispanic women in Texas as 6.3%. Is there sufficient evidence to indicate the population of Hispanic women in San Antonio has a prevalence of IFG higher than 6.3%? Use 95% confidence level and the p -value method to form your conclusion. Choose the correct null and alternative hypothesis.