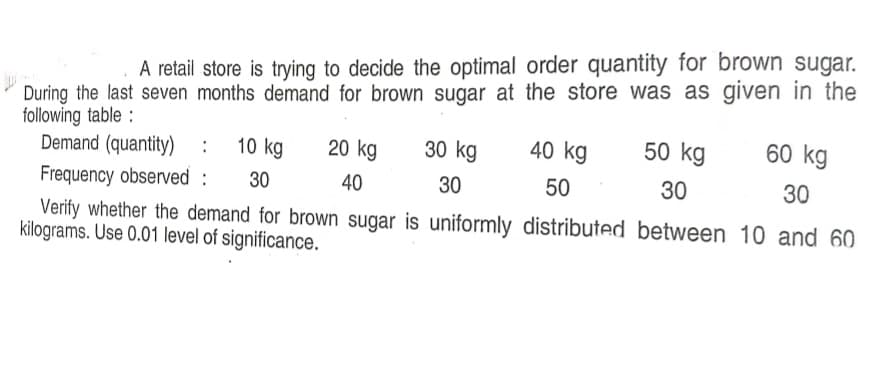
During the last seven months demand for brown sugar at the store was as given in the following table : Demand (quantity) : Frequency observed : Verify whether the demand for brown sugar is uniformly distributed between 10 and 60 kilograms. Use 0.01 level of significance. A retail store is trying to decide the optimal order quantity for brown sugar. 10 kg 20 kg 30 kg 40 kg 50 kg 60 kg 30 40 30 50 30 30


Q: The mean of 200 items was 50. Later on it was dis- covered that two items were misread as 92 and 8 i...
A:
Q: The Gamma distribution is often used to describe the wait time until a certain number of events occu...
A: Introduction: We need to find the maximum likelihood estimator (MLE) of the parameter β, for the gam...
Q: Suppose 40 percent of the customers at Pizza Palooza order a square pizza, 70 percent order a soft d...
A: Define the events: Let A denote the event that customers order a square pizza Let B denote the event...
Q: Example 6-26. If the possible values of a variate X are 0, 1, 2, 3, ... then 00 E(X) = 2 P(X > n) n=...
A:
Q: Problem : A system requires a reliability of 0.95 for ten hour operating period. It consists of thre...
A:
Q: 11. Old Faithful Data Set 23 “Old Faithful" in Appendix B includes data from 250 randon eruptions of...
A: We are given that Significance level =0.05
Q: probability of randomly selecting someone with an IQ score that is (a) less than 80? (b) greater tha...
A: NOTE: as per policy i have calculated 3 subparts plz repost from reamining here mean = 100 and stan...
Q: Suppose the data below represent, in thousands, the type of health insurance coverage of people by a...
A: Given data
Q: [For questions 8, 9, and 10] - The old Nokia 3310 battery lasts 31 hours on standby. Nokia produces ...
A:
Q: What does the standard deviation measure?
A:
Q: Example 6-19. From a point on the circumference of a circle of radius 'a', a chort drawn in a random...
A:
Q: You are given the sample mean and the population standard deviation. Use this information to constru...
A: Find 90% C.I and 95% C.I
Q: In each situation, find the value of the standardized statistic for the sample mean, and indicate wh...
A: Givena)x = 195μ=190s=21n=4
Q: The prime Minister of a small Caribbean Island stated that 95% of the population was vaccinated from...
A:
Q: Compute price index for the following data by applying weighted average of price relatives method us...
A: Answer:
Q: ## Вeef ## Pork Yes No Total ## Yes 75 492 567 ## No 441 8827 9268 ## Total 516 9319 9835 (a) Comput...
A: Given The table is as follows:
Q: Among a student group 51% use Google Chrome, 20% Internet Explorer, 10% Firefox, 5% Mozilla, and the...
A:
Q: Example 6-24. Use the relation E(AXª+BX'+CX°)² >0, X being a random variable with E(X) = 0, E denoti...
A:
Q: Suppose we begin with a population of normally distributed values with mean zero and S.D. = 1 and we...
A:
Q: Let p be the population proportion for the following condition. Find the point estimates for p and q...
A: Given: n=4507 No of successes(x)=2262
Q: how do I use markov's and chepyshev's inequalities to obtain bounds for the probability of having an...
A: Using Markov's Inequality: According to Markov's Inequality, if X is a non-negative random variable ...
Q: How likely is it for a vehicle to have an accident history if it was known to be a car or a bus?
A: Here complete table
Q: Marks obtained by 9 students in statistics are given w: 52, 75, 40, 70, 43, 40, 65, 35, 48. Calculat...
A: Given: marks obtained of 9 students are given Xi: 52,75,40,70,43,40,65,35,48 find arithmetic mean ...
Q: Explain Statistics & Sampling Variability and how does it affect the parameters and random variables...
A: The number that can be computed from sample data is a statistic. x=sample means=standard deviation ...
Q: O what ase Ame cdas tvok we first wo cars to elave willpe G Tayuta ond a Bmu in tcaet order?
A: Here given data for 25 cars Here probability =(no of Favorable)/(total outcomes)
Q: In a random sample of 26 people, the mean commute time to work was 33.9 minutes and the standard dev...
A: Given,sample size(n)=26sample mean(x¯)=33.9standard deviation(s)=7.2degrees of freedom(df)=n-1df=26-...
Q: In a shipment of 25 hard disks, six are defective. If five of the disks are selected at random, what...
A:
Q: [-74 The variable X has a normal distribution with mean u = 100 and standard deviation o = 8. The va...
A:
Q: The SHS program offered by randomly selected schools O The career choices of randomly selected SHS s...
A: Variable means a notation that takes varying values. For example, X can denote a variable that can t...
Q: In a survey of 2001 adults in a recent year, 701 made a New Year's resolution to eat healthier. Cons...
A: Given: n = 2001 x = 701
Q: Problem 3 An electric company is studying the relationship between the energy consumption (in thousa...
A: The following data is given: Number of rooms 13 9 14 6 10 7 11 10 5 7 Energy Consumption 9 7 11...
Q: The personality variable extraversion is normally distributed in the population and has a mean of 10...
A:
Q: Suppose you physically simulate the random process of rolling a single die. (a) After 10 rolls of th...
A: Given information: Suppose we simulate the random process of rolling a single die. a) After 10 rolls...
Q: how are parameters and statistics related?
A: Parameter: The parameter is used to explain the entire population. For example, a teacher calculated...
Q: If there is only one molecule of gas in the system (N=1), then there are 2 possible microstates for ...
A: 1. The possible number of microstates for N=3 is calculated below: Formula: The possible microstates...
Q: The manager of a department store is thinking about establishing a new billing system for the store’...
A: Given Sample size, n=200Sample mean, x¯=74α=0.05
Q: For each problem, conduct the appropriate inferential test using hypothesis testing steps: 1. Please...
A: There are 2 independent samples which are type A and type B. We have to test whether type A behavior...
Q: Property 9. If | ¢x (s) I =1 for some s#0, then for some real a, X-a is a lattice variable with mesh...
A:
Q: Exercise 6: A reporter for the local newspaper is preparing an article on the ice-cream stores in th...
A: d) Given data is 2.48,2.57,2.30,2.79,2.25,3.00,2.82,2.72,2.55,2.98,2.53,2.40,2.80,2.50,2.65Arrange t...
Q: The 90% confidence interval for the population proportion p is (0.706. 0.738) (Round to three decima...
A: Given: sample size, n=2063 Number of adults made resolution, x=1489
Q: The table below shows how many employees owned 0, 1, 2, or 3 cars in a company made up of 15 employe...
A:
Q: Find the minimum sample size n needed to estimate u for the given values of c, o, and E. c= 0.98, o ...
A: Using Excel formula “=NORM.S.INV(1-(0.02/2))”, the z-value for 98% confidence is 2.326.
Q: a lottery game, 4 numbers are chosen at random. Each number can take a value 1, 2, 3, or 4, and each...
A: Here Given In game of lottery 4 numbers are .chosen at random and each has equally likely So Probab...
Q: An five tosses of a coin, find the probability of getting exactly x heads and hence find the expecte...
A:
Q: It is reported that a survey had a standard error of the mean of 20, and it is assumed that the popu...
A: Given information- Population standard deviation (σ) = 500 Standard error of the mean (SE) = 20 We h...
Q: Consider two events A and B such that P(A) = 1 and P(B/A) 4 1 Examine the P(A/B) following statement...
A: Given the two events A & B such that, P(A) = 1/8, P(B|A)= 1/6 and P(A| B) = 1/4
Q: Consider the average fish frequency of the greater area to have a mean of 120 and a standard deviati...
A:
Q: The mean number of errors on a test area on a disk is 0.2. Find the probability that a test area has...
A: Let X denote the number of errors on a test area. It is given that mean number of errors = 0.2 Note ...
Q: researcher believes that table-top role playing games can change creative intelligence through probl...
A: Claim : D&D demonstrate a difference in creative intelligence.
Q: 10. If Q, is 200 and the IQR is 50, which of the following is true? (a) 50% of the values are betwee...
A: Given that Q1=200 , IQR=50 Note: According to bartleby experts question answers guidelines an exper...

Step by step
Solved in 3 steps with 3 images

- The following data show the results of random sample of 10 batches of one pattern of product: Sample Batch Size X Support Costs Y 1 10 10$ 2 12 15 3 15 20 4 20 22 5 10 15 6 25 25 7 20 30 8 12 10 9 15 20 10 30 30 Calculate: Using High and Low method and predict Variable cost and fixed cost of the above information.Given the following data for demand at Southern Industries Ltd, calculate the forecast forperiods 4-10 using a 3 -period weighted moving average. The weight of 0.5, 0.3 and 0.2are assigned to the most recent period respectively. Determine the MAD, (mean absolutedeviation). Assume the control limit for the tracking signal is ± 5. Is this a good forecast? Period Demand Forecast Error MAD1 742 903 594 915 1406 987 1108 1239 99 10 112Because of high tuition costs at state and private universities, enrollments atcommunity colleges have increased dramatically in recent years. The following data show theenrollment (in thousands) for Jefferson Community College from 2001–2009:Year Period (t) Enrollment (1000s)2001 1 6.52002 2 8.12003 3 8.42004 4 10.22005 5 12.52006 6 13.32007 7 13.72008 8 17.22009 9 18.1Compute F10: the Forecast for 2010. Compute Pearson’s Correlation Coefficient Use the Method of Least Squares to obtain the Best-Fit-Line for this data. Use the line to compute the forecast.
- ABC Company has decided to use 20 test markets to examine the sensitivity of demand for its new product, Hand Sanitizer, to various prices, as shown in the following table. Each market had approximately the same level of business activity and population. Test Market Quantity sold (Thousands of Pens) Price Charged (cent) 1 20 50 2 21 50 3 19 55 4 18 60 5 20 60 6 14 65 7 16 65 8 20 70 9 12 70 10 14 80 11 12 70 12 10 70 13 14 65 14 16 90 15 18 45 16 16 70 17 20 65 18 12 80 19 18 70 20 10 50 Q.1. Using a linear regression model, estimate the demand function for ABC Company’s new product, Hand sanitizer. Q.2. Interpret the coefficient value of the independent variable of the estimated demand function. Q.3. What will be the predicted/estimated sale for each price shown in column 2? Q.4. Find the prediction interval at…Sample data on weekly sales of two dairy products, X and Y were reported as follows: Lilongwe dairy, X 120 100 160 250 180 130 300 40 Long life, Y 70 86 67 100 45 80 90 95 a. Apply the CV, and find out which of the 2 products shows greater fluctuations in sales.A horticulture student is interested on the antifungal properties of three plant species. Leaf extracts from each species were mixed with agar based growth medium and poured into 5 Petri dishes. The Petri dishes were streaked with fungi isolates and the area in sq mm of fungal growth was measured after seven days. Assuming the areas of growth are not normally distributed, which is the most appropriate analysis for the experiment to find difference? A. Kruskal Wallis B. Friedman C. t-test D. sign test
- Suppose there are three fare classes in an airline fares p1 = $300, p2 = $200, and p3 = $100. You want to utilize the EMSR-b heuristic to calculate the protection level for classes 1 and 2 together. The demand distribution for class 1 is Normal with mean 50 and standard deviation 5. The demand distribution for class 2 is Normal with mean 75 and standard deviation 12. What is the price for the virtual class 1-2 under EMSR-b?Q1A) List down the measures of central tendency and measures of dispersion 1) Q1B) The operations manager of a plant that manufactures tires wants to compare the actual inner diameters of two grades of tires, each of which is expected to be 575 millimeters. A sample of five tires of each grade was selected, and the results representing the inner diameters of the tires, ranked from smallest to largest, are as follows. Grade X grade Y 568 570 575 578 584 573 574 575 577 578 requirement. a) for each of the tow grades of tries, compute the mwan, median, and standred deviation. b) which grade of tire providing better quality? explain. c) what would be the effect on your answer in (a) and (b) if the last value for grade Y were 588 insert 578 explain. PLEAS ANSWER Q1&B. THANK YOU.Compute the sum-of-squares error (SSE) by hand for the given set of data and linear model. (6, 6), (7, 7), (9, 10); y = x − 1
- The accompanying dataset shows the monthly number of new car sales in the last two years. Implement the Holt-Winters multiplicative seasonality model with trend. Find the best combination of α, β, and γ to minimize MSE. α=0.2, β=1, γ=0.2; α=0.6, β=0.4, γ=0.6 First find the MSE for each set of values, α, β, and γ. (Round to the nearest whole number as needed.) α β γ MSE 0.2 1 0.2 enter your response here 0.6 0.4 0.6 enter your response here Month Period Units Jan 1 39,808 Feb 2 40,081 Mar 3 47,440 Apr 4 47,297 May 5 49,210 Jun 6 51,479 Jul 7 46,466 Aug 8 45,208 Sep 9 44,801 Oct 10 46,990 Nov 11 42,161 Dec 12 44,187 Jan 13 42,227 Feb 14 45,421 Mar 15 54,076 Apr 16 50,926 May 17 53,572 Jun 18 54,921 Jul…Q1 A) List down the measures of central tendency and measures of dispersion 2) The operations manager of a plant that manufactures tires wants to compare the actual inner diameters of two grades of tires, each of B) which is expected to be 575 millimeters. A sample of five tires of each grade was selected, and the results representing the inner diameters of the tires, ranked from smallest to largest, are as follows. Grade X grade Y 568 570 575 578 584 573 574 575 577 578 requirement. a) for each of the tow grades of tries, compute the mwan, median, and standred deviation. b) which grade of tire providing better quality? explain. c) what would be the effect on your answer in (a) and (b) if the last value for grade Y were 588 insert 578 explain. C) The file contins the overall miles per gallon (MPG) OF 2010 family sedan: 24 21 22 23 24 34 34 34 20 20 22 22 44 32 20 20 22 20 39 20 Source:…Here is a dataset containing plant growth measurements of plants grown in solutions of commonly-found chemicals in roadway runoff.Phragmites australis, a fast-growing non-native grass common to roadsides and disturbed wetlands of Tidewater Virginia, was grown in a greenhouse and watered with either: Distilled water (control); A weak petroleum solution (representing standard roadway runoff); Sodium chloride solution; Magnesium chloride solution; De-icing brine (50% sodium chloride and 50% magnesium chloride).Twenty grass preparations were used for each solution, and total growth (in cm) was recorded after watering every other day for 40 days.-Perform the correct statistical test to determine the p-value.-Report your answer rounded to four decimal places.-You should use formulas, functions, and the Data Analysis ToolPak in MS Excel to avoid additive rounding errors. Here are some useful functions: =t.test(array1,array2,tails,type) Produces a p-value for any…