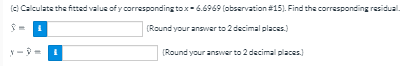
(e) Calculate the fitted value of y corresponding to x- 6.6969 (observation 15). Find the corresponding residua (Round your answer to 2 decimal places.) (Round your answer to 2 decimal places.)


Q: In Hn.7 Sec a wheel whose diameter 19 7.3ft, sotates 67266 tiones. Hou far Will point on the edge of…
A:
Q: The relative error in reading a galvanometer is given by tanx + cotx, where x is the angular…
A:
Q: Which image shows a tangent line?
A: Tangent is a line that touches the circle only at a single point.
Q: State the theorem of Arc Length.
A: State the theorem of Arc Length. The arc length is x360°2πR. here R is the radius of the arc and x…
Q: A cylindrical water tank 4 meters high with a radius of 2 meters is buried so that the top of the…
A:
Q: 3. Light of wavelength 575 nm falls on a double-slit and the third order bright fringe is seen at an…
A: Please see the attachment According to the guidelines we are supposed to do one problem
Q: tan 44.1°
A:
Q: Find the on y^2=8x whose focal distance is 10?
A:
Q: 3 Select the angles with a tangent ratio of 4 ZA ZE
A:
Q: The shape of y = V that has been reflected across the origin. Preview
A: To find:
Q: Find the coordinates of a point on a circle with radius 10 corresponding to an angle of 55° (x, y) =…
A:
Q: The gruph o i shown here Ideatify the graph of the inerve finction - (B,
A: The inverse of a one-to-one function f(x) is another function that reverse the function f(x). That…
Q: If the foundation of a structure with a degree of freedom is affected by displacement with the…
A: Given:- U g(t)=10 sin (30t)
Q: The best predicted value of y for an adult male who is 157 cm tall is kg. (Round to two decimal…
A:
Q: QUESTION 2. Use the trapezoidal rule with n = 10 to approximate. = the error. da and estimate
A: Given: The integral ∫01ex2dx . To find: Aproximate the given integral using the trapezoidal rule…
Q: Suppose I throw a baseball with an initial velocity of 80 ft/sec at an angle of 30 degrees to the…
A:
Q: The accompanying table shows the velocity of a model train engine moving along a track for 10…
A:
Q: on. Find the method of moment estimate for 0
A: Given that sample size n = 4, Y1 = 0.42, Y2 = 0.1, Y3 = 0.65, Y4 = 0.23
Q: Find the exact length of the curve In(cosit) 13 rc)=
A:
Q: What is the frequency of a tangent function whose period is 6π?
A: Period of tangent function =pi/n
Q: Graph the limaçon. Cardioids r = -1 + sin u
A: Given- r=-1+sinu To Draw- The graph of the above equation of the limaçon.
Q: The best predicted value of y is (Round to two decimal places as needed.)
A: The regression equation is y^=17.16+0.84x.
Q: The best predicted value of y for an adult male who is 171 cm tall is Round to two decimal places as…
A: Given value of P = 0.000 Here, P value is less than the given significance level (0.05), so we can…
Q: 7.) What is the measure of arc RP? *
A: Given: - The figure is, To find: -The measure of the arc RP.
Q: Find the coordinates of a point on a circle with radius 10 corresponding to an angle of 210° (x,y) =…
A: Given, A circle with radius r=10.
Q: 4. A projectile is launched with an initial speed of 40 m/s from the floor of a tunnel whose height…
A:
Q: What is the definition and formula for arc length?
A: The arc length is the measure of the distance along an arc in a circle. The length of arc is…
Q: Find the coordinates of a point on a circle with radius 20 corresponding to an angle of 160° (x,y) =…
A: Given that , Radius of circle r=20 angle θ=160° find the coordinates of a point.
Q: Suppose θ(t) measures the minimum angle between a clock’s minute and hour hands in radians. Find,…
A: Given that: θ (t) measures the minimum angle between a clock’s minute and hour hands in radians. An…
Q: A straight hiking trail is 2500 ft long with a gain in altitude of 310 ft to the nearest degree what…
A:
Q: what z value correlates to 98.96% under the curve
A: If Z represents standard normal distribution, then we need to find the value z such that…
Q: -11 -, find the exact value of its x-coordinate. (Decimal approximation 61 A point in quadrant IIl…
A: A point in the 3rd Quadrant of the x-y plane has both x and y coordinates negative. Equation of a…
Q: What do you mean by adaptive quadrature method? Compute cos x dx by adaptive quadrature method and…
A: Composite rules can be used to implement an automatic quadrature procedure, in which the all ofthe…
Q: A new type of fabric is claimed to be wrinkle-free. There are other wrinkle-free fabrics in the…
A:
Q: Graph the Ine whose x-tercept is -I and whose y-intercnpt is 1.
A: Given, The line whose x-intercept is -1 and y-intercept is 1.We know that, The…
Q: 11
A: A tangent is a line segment which touches the circle at only one point. A tangent is perpendicular…
Q: Find the distance between the points (21, 4) and (3, 26). Give the exact distance and an…
A: Let A(21,4) and B(3,26) To evaluate distance between AB
Q: (b) Use the equation of the best fitting curve from part (a) to predict the distance required to…
A: (a) The curve in figure 1 perfectly fits the the data set
Q: What is the measure of arc RP?
A: Since you have asked multiple questions, we will solve the first question for you. If you want any…
Q: Find the length of the arc x2 = (y- 4)³ from (1,5) to (8,8).
A: In this question we have to find the length of the arc.
Q: find the temperature in a bar of length 2 whose ends are kept at zero and lateral surface insulated…
A: Consider a bar of length 2 whose ends are kept at 0 temperature. The lateral surface is insulated.…
Q: Use an appropriate linear approximation to estimate cos(60.5" (Round your answer to three decimal…
A: To use the linear approximation to estimate cos(60.5°)
Q: Use a linear approximation to estimate sin 29°
A:
Q: Find the length of y= * over the intersal arc 85x51
A: To find the length of curve between x = 1 to x= 8
Q: What is the approximate lenght of arc HS
A: here we can find the first length of the radius by dividing the diameter by 2 and after that, by…
Q: stion 6.13 Velod ove, a particle has - al distance traveled
A:

Step by step
Solved in 2 steps with 3 images

- Olympic Pole Vault The graph in Figure 7 indicates that in recent years the winning Olympic men’s pole vault height has fallen below the value predicted by the regression line in Example 2. This might have occurred because when the pole vault was a new event there was much room for improvement in vaulters’ performances, whereas now even the best training can produce only incremental advances. Let’s see whether concentrating on more recent results gives a better predictor of future records. (a) Use the data in Table 2 (page 176) to complete the table of winning pole vault heights shown in the margin. (Note that we are using x=0 to correspond to the year 1972, where this restricted data set begins.) (b) Find the regression line for the data in part ‚(a). (c) Plot the data and the regression line on the same axes. Does the regression line seem to provide a good model for the data? (d) What does the regression line predict as the winning pole vault height for the 2012 Olympics? Compare this predicted value to the actual 2012 winning height of 5.97 m, as described on page 177. Has this new regression line provided a better prediction than the line in Example 2?The Pilot Pen Company has decided to use 15 test markets to examine the sensitivity of demand for its new product to various prices, as shown in the following table. Advertising effort was identical in each market. Each market had approximately the same level of business activity and population.a. Using a linear regression model, estimate the demand function for Pilot’s new pen.b. Evaluate this model by computing the coefficient of determination and by performing a t-test of the significance of the price variable.c. What is the price elasticity of demand at a price of 50 cents? TEST MARKET PRICE CHARGED (¢) QUANTITY SOLD(THOUSANDS OF PENS) 1 2 3 4 5 6 7 8 9 10 11 12 13 14 15 50 50 55 55 60 60 65 65 70 70¢ 80 80 90¢ 90 40 20.0 21.0 19.0 19.5 20.5 19.0 16.0 15.0 14.5 15.5 13.0 14.0 11.5 11.0 17.0An oil exploration company wants to develop a statistical model to predict the cost of drilling a new well. One of the many variables thought to be an important predictor of the cost is the number of feet in depth that the must be drilled to create the well. Consequently, the company decided to fit the simple linear regression model, where y = cost of drilling the new well (in $thousands) and x = number of feet drilled to create the well. Using data collected for a sample of n=83 wells, the following results were obtained: = 10.5 + 16.20x Give a practical interpretation of the estimate of the slope of the least squares line. An oil exploration company wants to develop a statistical model to predict the cost of drilling a new well. One of the many variables thought to be an important predictor of the cost is the number of feet in depth that the must be drilled to create the well. Consequently, the company decided to fit the simple linear regression model, where y =…
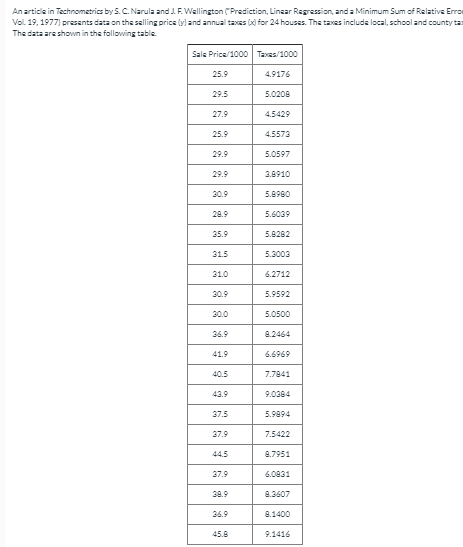
- Suppose that a regional express delivery service company wants to estimate the cost of shipping a package (Y) as a function of cargo type, where cargo type includes the following possibilities: fragile, semi-fragile, and durable. Costs for 15 randomly chosen packages of approximately the same weight and same distance shipped, but of different cargo types, are provided in the file P14_16.xlsx. a. Estimate a regression equation using the given sample data, and interpret the estimated regression coefficients. b. According to the estimated regression equation, which cargo type is the most costly to ship? Which cargo type is the least costly to ship? c. How well does the estimated equation fit the given sample data? How might the fit be improved? d. Given the estimated regression equation, predict the cost of shipping a package with semi-fragile cargo.1. Distinguish between the following:a. Heteroskedasticity and autocorrelationb. specified regression model vs estimated regression equationc. data type vs level of measurementd. ANOVA and Multiple Regressione. Outliers vs InfluencersAn article in Wear (Vol. 152, 1992, pp 171-181) presents data on the fretting wear of mild steel and oil viscosity. Representative data follow, with x = oil viscosity and y = wear volume (10-4 mm3) : 1. Determine the coefficient of determination. 2. Test the significance of the correlation coefficient. 3. Find the simple linear regression model. 4. Predict fretting wear when viscosity is 30. Construct a prediction interval for the estimate. 5. Do you think Simple Linear Regression is the best relationship to use for this data? Test for Linear Transforms and come up with a conclusion.
- The variable descriptions and Stata outputs from the simple and multiple linear regression are available in the picture that i have provided. Using those informations, can you answer the following questions. - Firstly, report the results from the regression of wage on educ in the form of a fitted line, with the standard error of coefficients presented in parentheses underneath the corresponding coefficients. Round the numbers to two decimal places. - Is the coefficient of educ statistically significant? - Now consider the multiple linear regression that includes KWW as one of the explanatory variables. Between this regression and the simple linear regression in part (a), which model is more likely to measure the ceteris paribus effect of education on wages? Explain and when possible use evidence to support your answer. Can you also provide the resource as well, please?Data was collected on 54 observations on a response of interest, y, and four potential predictor variables x1, x2, x3, and x4. The output from regression analyses of the data is attached to the end of the page. d) Is the variable from your best simple linear regression model (from part a) included in the model with the lowest overall MSE (part b)? Briefly explain why it could happen that the best single variable is not in the best overall model. e) Following the best subsets regression results, the sums of squares for regression and error (also called residual) are displayed for several models. Using the regression sums of squares information for the full model containing all four x variables, calculate i) the R2 value for the full model, ii) the F statistic for the test of the H0: b1 = b2 = b3 = b4 = 0, and iii) the standard deviation of the residuals for the full model. f) Using the regression sums of squares information, test the null hypothesis H0:b2 = b4 = 0 for the full model.…1. Plot the data points on a scatter diagram. 2. Determine the equation of the regression line and find Pearson product-moment correlation coefficient. 3. Determine the point estimate of y at x = 5.5
- The systolic blood pressure dataset (in the third sheet of the spreadsheet linked above) contains the systolic blood pressure and age of 30 randomly selected patients in a medical facility. What is the equation for the least square regression line where the independent or predictor variable is age and the dependent or response variable is systolic blood pressure? Y=__________ X + ______________ Patient 7 is 67 years old and has a systolic blood pressure of 170 mm Hg. What is the residual? __________ mm Hg Is the actual value above, below, or on the line? What is the interpretation of the residual? (difference in actual &predicated bp, difference in age, the amount of systolic changes)The coefficients in a distributed lag regression of Y on X and its lags can be interpreted as the dynamic causal effects when the time path of X is determined randomly and independently of other factors that influence Y. Explain How?1. Data was collected on 54 observations on a response of interest, y, and four potential predictor variables x1, x2, x3, and x4. The output from regression analyses of the data is attached to the end of the page. a) For the best subsets regression analysis, which is the best simple linear regression model for predicting y? Briefly explain your criteria for choosing this model. b) For all of the models listed in the best subsets regression analysis, which model is best according to the MSE criterion. c) For all of the models listed in the best subsets regression analysis, which model is best according to the BIC criterion? d) Is the variable from your best simple linear regression model (from part a) included in the model with the lowest overall MSE (part b)? Briefly explain why it could happen that the best single variable is not in the best overall model. e) Following the best subsets regression results, the sums of squares for regression and error (also called residual) are…