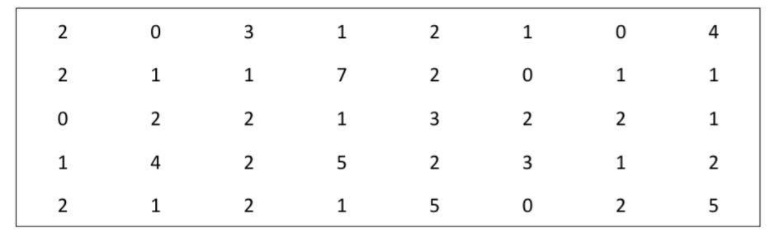
e data below list the number of laptop computers owned by families in each of 40 homes in a subdivision. Draw the
e data below list the number of laptop computers owned by families in each of 40 homes in a subdivision. Draw the

Algebra & Trigonometry with Analytic Geometry
13th Edition
ISBN:9781133382119
Author:Swokowski
Publisher:Swokowski
Chapter1: Fundamental Concepts Of Algebra
Section1.1: Real Numbers
Problem 50E

Related questions
Question
The data below list the number of laptop computers owned by families in each of 40 homes in a subdivision. Draw the frequency distribution of the following list of data. Then find their
Transcribed Image Text:2
1
2
1
4
1
1
7
2
1
1
1
2
2
1
4
2
5
2
2
2
5
1.
2.
1,
3.
1,
2.
1.
2.
2.
Expert Solution
This question has been solved!
Explore an expertly crafted, step-by-step solution for a thorough understanding of key concepts.

Step by step
Solved in 3 steps with 3 images

Knowledge Booster


Learn more about
Need a deep-dive on the concept behind this application? Look no further. Learn more about this topic, statistics and related others by exploring similar questions and additional content below.Recommended textbooks for you
Algebra & Trigonometry with Analytic Geometry
Algebra
ISBN:
9781133382119
Author:
Swokowski
Publisher:
Cengage
Algebra & Trigonometry with Analytic Geometry
Algebra
ISBN:
9781133382119
Author:
Swokowski
Publisher:
Cengage