e inflection point on the graph and explain its significance for the rabbit population. ur answer to the nearest integer. ction point is approximately i years after Captain Cook left th with the population
e inflection point on the graph and explain its significance for the rabbit population. ur answer to the nearest integer. ction point is approximately i years after Captain Cook left th with the population

Algebra & Trigonometry with Analytic Geometry
13th Edition
ISBN:9781133382119
Author:Swokowski
Publisher:Swokowski
Chapter4: Polynomial And Rational Functions
Section4.3: Zeros Of Polynomials
Problem 64E

Related questions
Question
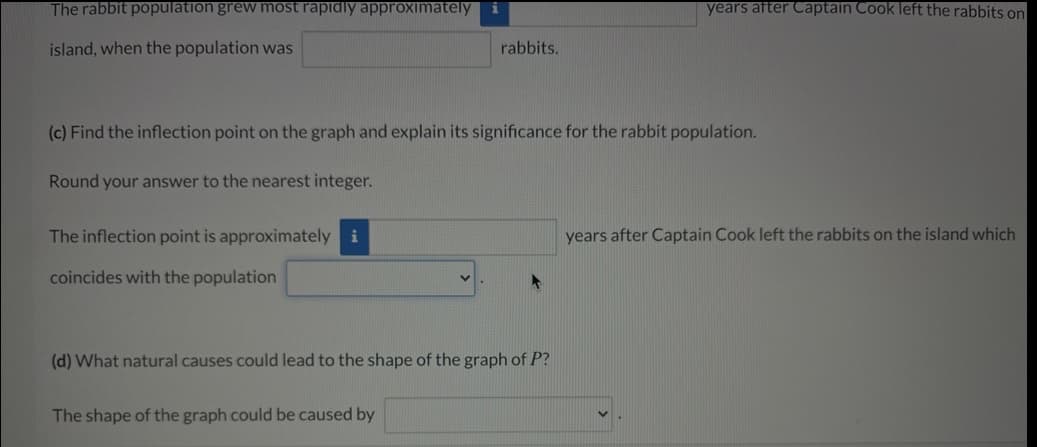
Transcribed Image Text:The rabbit population grew moOst rapidly apprOximately
years after Captain Cook left the rabbits on
island, when the population was
rabbits.
(c) Find the inflection point on the graph and explain its significance for the rabbit population.
Round your answer to the nearest integer.
The inflection point is approximately i
years after Captain Cook left the rabbits on the island which
coincides with the population
(d) What natural causes could lead to the shape of the graph of P?
The shape of the graph could be caused by
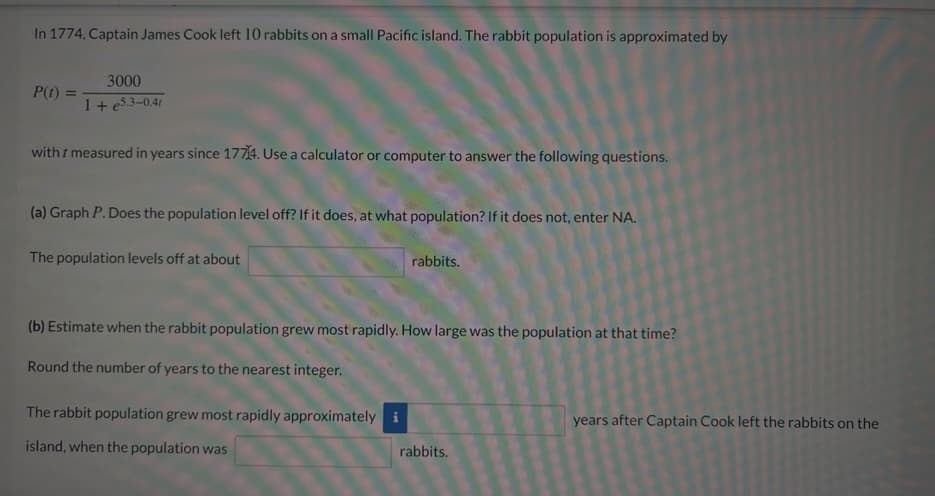
Transcribed Image Text:In 1774, Captain James Cook left 10 rabbits on a small Pacific island. The rabbit population is approximated by
3000
P(t) =
1+ e53-0.41
%3D
with t measured in years since 1774. Use a calculator or computer to answer the following questions.
(a) Graph P. Does the population level off? If it does, at what population? If it does not, enter NA.
The population levels off at about
rabbits.
(b) Estimate when the rabbit population grew most rapidly. How large was the population at that time?
Round the number of years to the nearest integer.
The rabbit population grew most rapidly approximately i
years after Captain Cook left the rabbits on the
island, when the population was
rabbits.
Expert Solution
This question has been solved!
Explore an expertly crafted, step-by-step solution for a thorough understanding of key concepts.

This is a popular solution!

Trending now
This is a popular solution!

Step by step
Solved in 4 steps with 1 images

Recommended textbooks for you
Algebra & Trigonometry with Analytic Geometry
Algebra
ISBN:
9781133382119
Author:
Swokowski
Publisher:
Cengage

College Algebra (MindTap Course List)
Algebra
ISBN:
9781305652231
Author:
R. David Gustafson, Jeff Hughes
Publisher:
Cengage Learning
Algebra & Trigonometry with Analytic Geometry
Algebra
ISBN:
9781133382119
Author:
Swokowski
Publisher:
Cengage
College Algebra (MindTap Course List)
Algebra
ISBN:
9781305652231
Author:
R. David Gustafson, Jeff Hughes
Publisher:
Cengage Learning