E Supplementary Exercise 7.4 1. The Land Transportation Office (LTO) is interested in the number of brand new cars imported into the Philippines in 2015. The following data are as follow: No. of Cars Imported Country Japan 225,000 South Korea 78,300 USA 120,250 United Kingdom 19,200 Italy China 16,750 40,500 Total 500,000 Sketch the pareto chart, bar chart and pie chart of the given data.
E Supplementary Exercise 7.4 1. The Land Transportation Office (LTO) is interested in the number of brand new cars imported into the Philippines in 2015. The following data are as follow: No. of Cars Imported Country Japan 225,000 South Korea 78,300 USA 120,250 United Kingdom 19,200 Italy China 16,750 40,500 Total 500,000 Sketch the pareto chart, bar chart and pie chart of the given data.

Holt Mcdougal Larson Pre-algebra: Student Edition 2012
1st Edition
ISBN:9780547587776
Author:HOLT MCDOUGAL
Publisher:HOLT MCDOUGAL
Chapter11: Data Analysis And Probability
Section: Chapter Questions
Problem 8CR

Related questions
Question
I need the answer as soon as possible
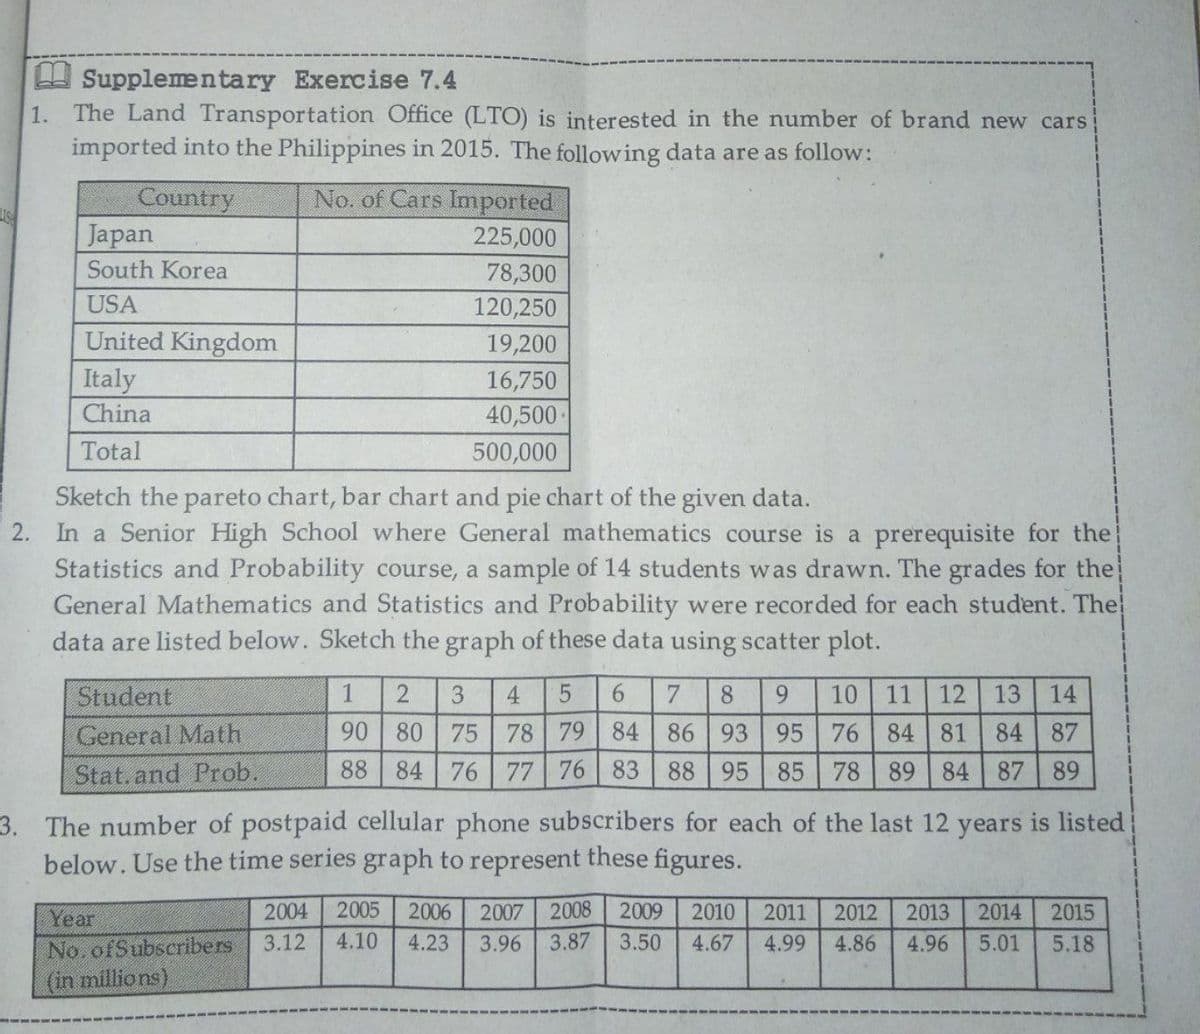
Transcribed Image Text:H Supplementary Exercise 7.4
1. The Land Transportation Office (LTO) is interested in the number of brand new cars
imported into the Philippines in 2015. The following data are as follow:
No. of Cars Imported
Country
Japan
225,000
South Korea
78,300
USA
120,250
United Kingdom
19,200
Italy
16,750
China
40,500-
Total
500,000
Sketch the pareto chart, bar chart and pie chart of the given data.
2. In a Senior High School where General mathematics course is a prerequisite for the
Statistics and Probability course, a sample of 14 students was drawn. The grades for the
General Mathematics and Statistics and Probability were recorded for each student. The
data are listed below. Sketch the graph of these data using scatter plot.
Student
General Math
Stat. and Prob.
1
2
6.
7
8.
9.
10
11
12
13
14
90
80
75
78 79 84
86
93
95
76
84 81
84
87
88 84
76
77 76 83
88 95 85 78
89
84 87 89
3. The number of postpaid cellular phone subscribers for each of the last 12 years is listed
below. Use the time series graph to represent these figures.
Year
2004
2005
2006
2007
2008
2009
2010
2011
2012
2013
2014
2015
4.10
No. ofSubseribers
(in millions)
3.12
4.23
3.96
3.87
3.50
4.67
4.99
4.86
4.96
5.01
5.18
Expert Solution
This question has been solved!
Explore an expertly crafted, step-by-step solution for a thorough understanding of key concepts.

This is a popular solution!

Trending now
This is a popular solution!

Step by step
Solved in 3 steps with 3 images

Recommended textbooks for you
Holt Mcdougal Larson Pre-algebra: Student Edition…
Algebra
ISBN:
9780547587776
Author:
HOLT MCDOUGAL
Publisher:
HOLT MCDOUGAL
Holt Mcdougal Larson Pre-algebra: Student Edition…
Algebra
ISBN:
9780547587776
Author:
HOLT MCDOUGAL
Publisher:
HOLT MCDOUGAL