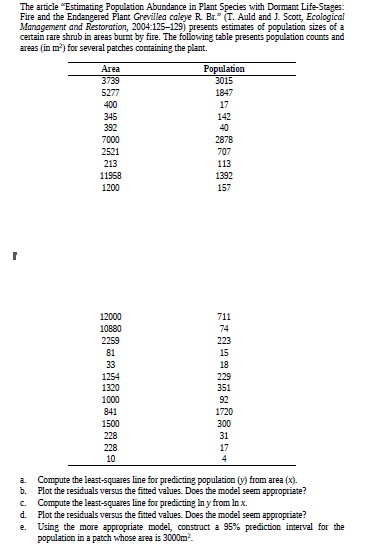
The article "Estimating Population Abundance in Plant Species with Dormant Life-Stages: Fire and the Endangered Plant Grevillea caleye R Br." (T. Auld and J. Scott, Ecological Management and Restoration, 2004:125-129) presents estimates of population sizes of a certain rare shrub in areas burnt by fire. The following table presents population counts and areas (in m?) for several patches containing the plant. Агеа 3739 Population 3015 5277 1847 400 17 345 392 142 40 7000 2521 213 11958 1200 2878 707 113 1392 157 12000 10880 711 74 2259 223 81 15 33 18 1254 1320 229 351 1000 92 841 1720 1500 300 228 31 228 17 10 Compute the least-squares line for predicting population (y) from area (x). Б. a. Plot the residuals versus the fitted values. Does the model seem appropriate? Compute the least-squares line for predicting In y from In x. Plot the residuals versus the fitted values. Does the model seem appropriate? Using the more appropriate model, construct a 95% prediction interval for the population in a patch whose area is 3000m. C. d. e.
The article "Estimating Population Abundance in Plant Species with Dormant Life-Stages: Fire and the Endangered Plant Grevillea caleye R Br." (T. Auld and J. Scott, Ecological Management and Restoration, 2004:125-129) presents estimates of population sizes of a certain rare shrub in areas burnt by fire. The following table presents population counts and areas (in m?) for several patches containing the plant. Агеа 3739 Population 3015 5277 1847 400 17 345 392 142 40 7000 2521 213 11958 1200 2878 707 113 1392 157 12000 10880 711 74 2259 223 81 15 33 18 1254 1320 229 351 1000 92 841 1720 1500 300 228 31 228 17 10 Compute the least-squares line for predicting population (y) from area (x). Б. a. Plot the residuals versus the fitted values. Does the model seem appropriate? Compute the least-squares line for predicting In y from In x. Plot the residuals versus the fitted values. Does the model seem appropriate? Using the more appropriate model, construct a 95% prediction interval for the population in a patch whose area is 3000m. C. d. e.

Linear Algebra: A Modern Introduction
4th Edition
ISBN:9781285463247
Author:David Poole
Publisher:David Poole
Chapter7: Distance And Approximation
Section7.3: Least Squares Approximation
Problem 31EQ

Related questions
Question
Transcribed Image Text:The article "Estimating Population Abundance in Plant Species with Dormant Life-Stages:
Fire and the Endangered Plant Grevillea caleye R Br." (T. Auld and J. Scott, Ecological
Management and Restoration, 2004:125-129) presents estimates of population sizes of a
certain rare shrub in areas burnt by fire. The following table presents population counts and
areas (in m?) for several patches containing the plant.
Агеа
3739
Population
3015
5277
1847
400
17
345
392
142
40
7000
2521
213
11958
1200
2878
707
113
1392
157
12000
10880
711
74
2259
223
81
15
33
18
1254
1320
229
351
1000
92
841
1720
1500
300
228
31
228
17
10
Compute the least-squares line for predicting population (y) from area (x).
Б.
a.
Plot the residuals versus the fitted values. Does the model seem appropriate?
Compute the least-squares line for predicting In y from In x.
Plot the residuals versus the fitted values. Does the model seem appropriate?
Using the more appropriate model, construct a 95% prediction interval for the
population in a patch whose area is 3000m.
C.
d.
e.
Expert Solution
This question has been solved!
Explore an expertly crafted, step-by-step solution for a thorough understanding of key concepts.

This is a popular solution!

Trending now
This is a popular solution!

Step by step
Solved in 3 steps with 3 images

Recommended textbooks for you
Linear Algebra: A Modern Introduction
Algebra
ISBN:
9781285463247
Author:
David Poole
Publisher:
Cengage Learning
Linear Algebra: A Modern Introduction
Algebra
ISBN:
9781285463247
Author:
David Poole
Publisher:
Cengage Learning