
ChapterA: Working With Diagrams
Section: Chapter Questions
Problem 2QP

Related questions
Question
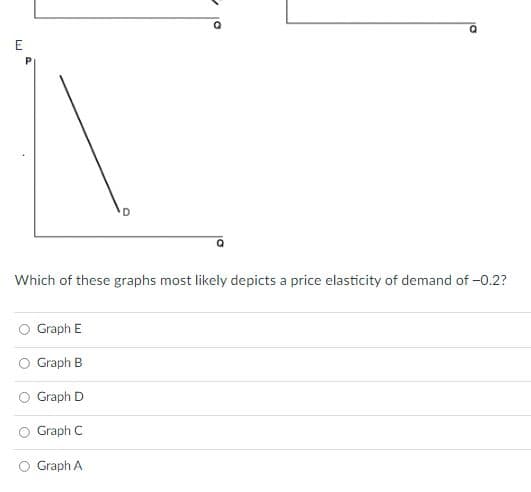
Transcribed Image Text:Which of these graphs most likely depicts a price elasticity of demand of -0.2?
Graph E
Graph B
Graph D
Graph C
O Graph A
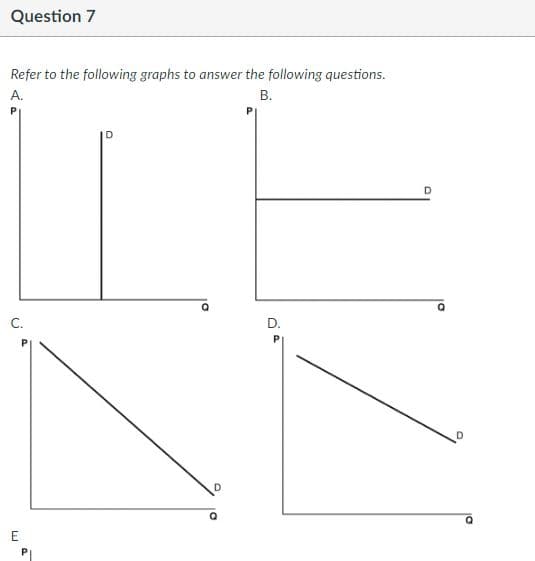
Transcribed Image Text:Question 7
Refer to the following graphs to answer the following questions.
А.
В.
D.
E
Expert Solution
This question has been solved!
Explore an expertly crafted, step-by-step solution for a thorough understanding of key concepts.

This is a popular solution!

Trending now
This is a popular solution!

Step by step
Solved in 3 steps

Recommended textbooks for you


Economics (MindTap Course List)
Economics
ISBN:
9781337617383
Author:
Roger A. Arnold
Publisher:
Cengage Learning
Economics (MindTap Course List)
Economics
ISBN:
9781337617383
Author:
Roger A. Arnold
Publisher:
Cengage Learning