e. Find the 75th percentile of the data set. Your answer f. Interpret (e). Your answer g. How many students have grades greater than or equal to the 75th percentile?
e. Find the 75th percentile of the data set. Your answer f. Interpret (e). Your answer g. How many students have grades greater than or equal to the 75th percentile?

Holt Mcdougal Larson Pre-algebra: Student Edition 2012
1st Edition
ISBN:9780547587776
Author:HOLT MCDOUGAL
Publisher:HOLT MCDOUGAL
Chapter11: Data Analysis And Probability
Section11.4: Collecting Data
Problem 2E

Related questions
Question
e f g h, pls answer all this is my last question. answer only
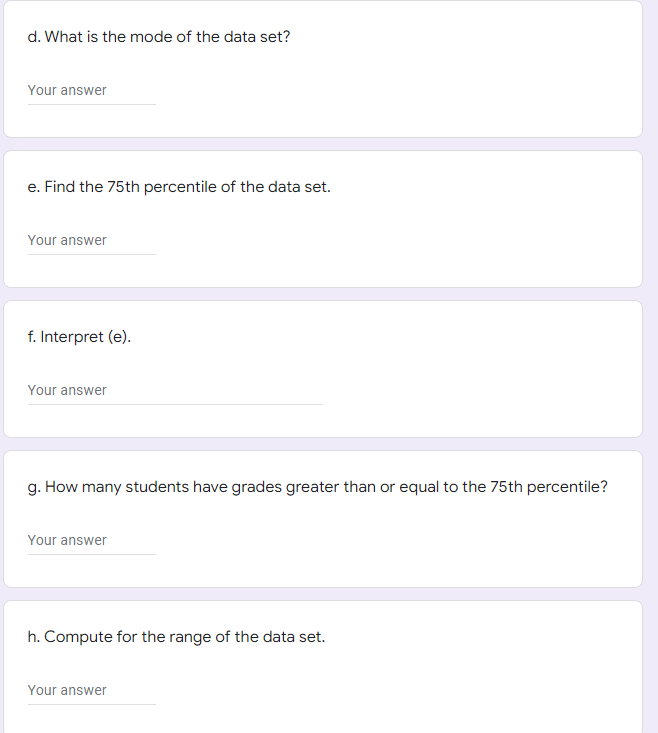
Transcribed Image Text:d. What is the mode of the data set?
Your answer
e. Find the 75th percentile of the data set.
Your answer
f. Interpret (e).
Your answer
g. How many students have grades greater than or equal to the 75th percentile?
Your answer
h. Compute for the range of the data set.
Your answer
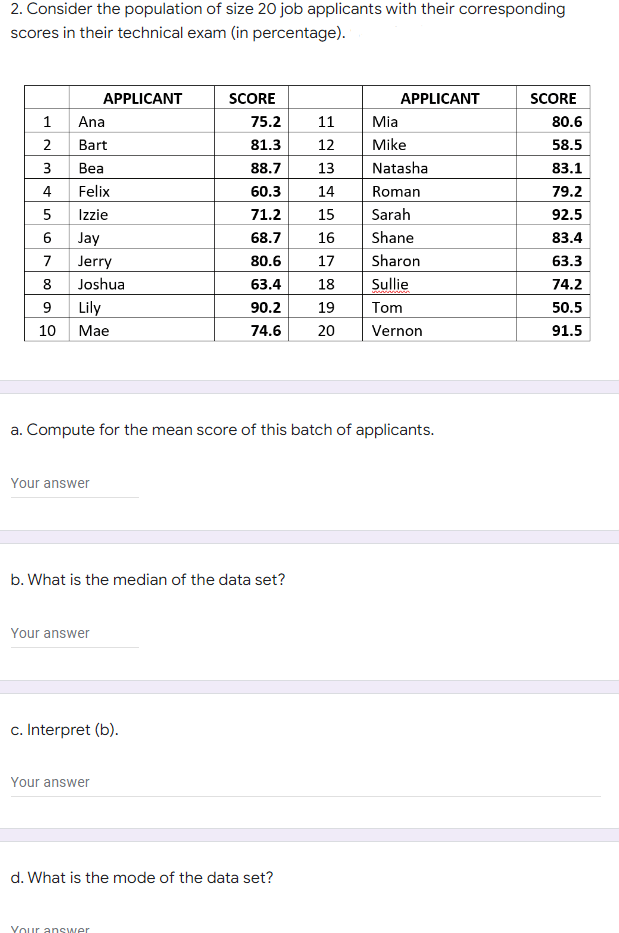
Transcribed Image Text:2. Consider the population of size 20 job applicants with their corresponding
scores in their technical exam (in percentage).
APPLICANT
SCORE
APPLICANT
SCORE
1
Ana
75.2
11
Mia
80.6
2
Bart
81.3
12
Mike
58.5
3
Bea
88.7
13
Natasha
83.1
4
Felix
60.3
14
Roman
79.2
5
Izzie
71.2
15
Sarah
92.5
Shane
Jay
Jerry
68.7
16
83.4
7
80.6
17
Sharon
63.3
8
Joshua
63.4
18
Sullie
74.2
9 Lily
90.2
19
Tom
50.5
10
Мае
74.6
20
Vernon
91.5
a. Compute for the mean score of this batch of applicants.
Your answer
b. What is the median of the data set?
Your answer
c. Interpret (b).
Your answer
d. What is the mode of the data set?
Vour answer
LO
Expert Solution
This question has been solved!
Explore an expertly crafted, step-by-step solution for a thorough understanding of key concepts.

Step by step
Solved in 2 steps

Recommended textbooks for you
Holt Mcdougal Larson Pre-algebra: Student Edition…
Algebra
ISBN:
9780547587776
Author:
HOLT MCDOUGAL
Publisher:
HOLT MCDOUGAL

Holt Mcdougal Larson Pre-algebra: Student Edition…
Algebra
ISBN:
9780547587776
Author:
HOLT MCDOUGAL
Publisher:
HOLT MCDOUGAL