Altitude (km) IERIC STRUCTURE 325 LAB EXERCISE #2 INTERPRETING A TEMPERATURE SOUNDING 10- 9. 8. 7. 6- 4- 3- 2- 1. -20 -10 (ɔ) dwel A radiosonde was launched at 6 a.m. and observed the temperatures recorded in this graphic. Use these envi- ronmental temperatures and your knowledge of rising air bubbles to answer the following: 1. Where is the inversion located? a 0.5 km b. 3 km c. 4 km d. 5 km 2. If Bob started out unsaturated at the surface with the same air temperature as the surface, 20 °C, and rose to 1 km, what would his air temperature be? 0°C b. 5°C a. C. d.) 15 °C 3. Compare your answer to the previous question to the environmental temperature observed at 1 km from the graph. What is the stability based on this comparison? a. Stable b. Neutral Unstable d Conditionally unstable 4. If you lifted an air bubble from the surface to 1 km, which statement best describes its vertical motion? a. It would continue to rise, because it is buoyant. b. It would remain at the level to which you lift it. c) It would fall, because it is not buoyant. 5. Based on the graph, what is the environmental lapse rate between 1 and 2 khi: a. 3°C/km b. 6°C/km C. 11 °C/km d. 22 °C/km 6. What is the stability of the layer between 1 and 2 km? a. Stable b. Neutral C. Unstable d. Conditionally unstable 7. What is the environmental lapse rate between 2 and 3 km? a. 3 °C/km b 7°C/km c. 10 °C/km d. 15 °C/km с. 8. What is the stability between 2 and 3 km? a. Stable b. Neutral с. Unstable d. Conditionally unstable 9. Later that day, the surface temperature rose, because the sun heated the ground. If the high tem- perature reached 30 °C and an air bubble rose and reached condensation at 1 km, what would be the bubble's temperature be at 2 km? a. 20 °C b. 16 °C c. 14 °C d. 10 °C 10. Compare your answer to the previous question to the environmental temperature from the graph to determine the continued motion of the bubble. It would continue to rise, because it is buoyant. a. b. It would remain at the level to which you lift it. It would fall, because it is not buoyant. с. 11. Where is the tropopause located in this sounding? a. 1 km b. 3 km c. 5 km d. 10 km
Altitude (km) IERIC STRUCTURE 325 LAB EXERCISE #2 INTERPRETING A TEMPERATURE SOUNDING 10- 9. 8. 7. 6- 4- 3- 2- 1. -20 -10 (ɔ) dwel A radiosonde was launched at 6 a.m. and observed the temperatures recorded in this graphic. Use these envi- ronmental temperatures and your knowledge of rising air bubbles to answer the following: 1. Where is the inversion located? a 0.5 km b. 3 km c. 4 km d. 5 km 2. If Bob started out unsaturated at the surface with the same air temperature as the surface, 20 °C, and rose to 1 km, what would his air temperature be? 0°C b. 5°C a. C. d.) 15 °C 3. Compare your answer to the previous question to the environmental temperature observed at 1 km from the graph. What is the stability based on this comparison? a. Stable b. Neutral Unstable d Conditionally unstable 4. If you lifted an air bubble from the surface to 1 km, which statement best describes its vertical motion? a. It would continue to rise, because it is buoyant. b. It would remain at the level to which you lift it. c) It would fall, because it is not buoyant. 5. Based on the graph, what is the environmental lapse rate between 1 and 2 khi: a. 3°C/km b. 6°C/km C. 11 °C/km d. 22 °C/km 6. What is the stability of the layer between 1 and 2 km? a. Stable b. Neutral C. Unstable d. Conditionally unstable 7. What is the environmental lapse rate between 2 and 3 km? a. 3 °C/km b 7°C/km c. 10 °C/km d. 15 °C/km с. 8. What is the stability between 2 and 3 km? a. Stable b. Neutral с. Unstable d. Conditionally unstable 9. Later that day, the surface temperature rose, because the sun heated the ground. If the high tem- perature reached 30 °C and an air bubble rose and reached condensation at 1 km, what would be the bubble's temperature be at 2 km? a. 20 °C b. 16 °C c. 14 °C d. 10 °C 10. Compare your answer to the previous question to the environmental temperature from the graph to determine the continued motion of the bubble. It would continue to rise, because it is buoyant. a. b. It would remain at the level to which you lift it. It would fall, because it is not buoyant. с. 11. Where is the tropopause located in this sounding? a. 1 km b. 3 km c. 5 km d. 10 km

Applications and Investigations in Earth Science (9th Edition)
9th Edition
ISBN:9780134746241
Author:Edward J. Tarbuck, Frederick K. Lutgens, Dennis G. Tasa
Publisher:Edward J. Tarbuck, Frederick K. Lutgens, Dennis G. Tasa
Chapter1: The Study Of Minerals
Section: Chapter Questions
Problem 1LR

Related questions
Question
Transcribed Image Text:Altitude (km)
IERIC STRUCTURE 325
LAB EXERCISE #2
INTERPRETING A TEMPERATURE SOUNDING
10-
9.
8.
7.
6-
4-
3-
2-
1.
-20
-10
(ɔ) dwel
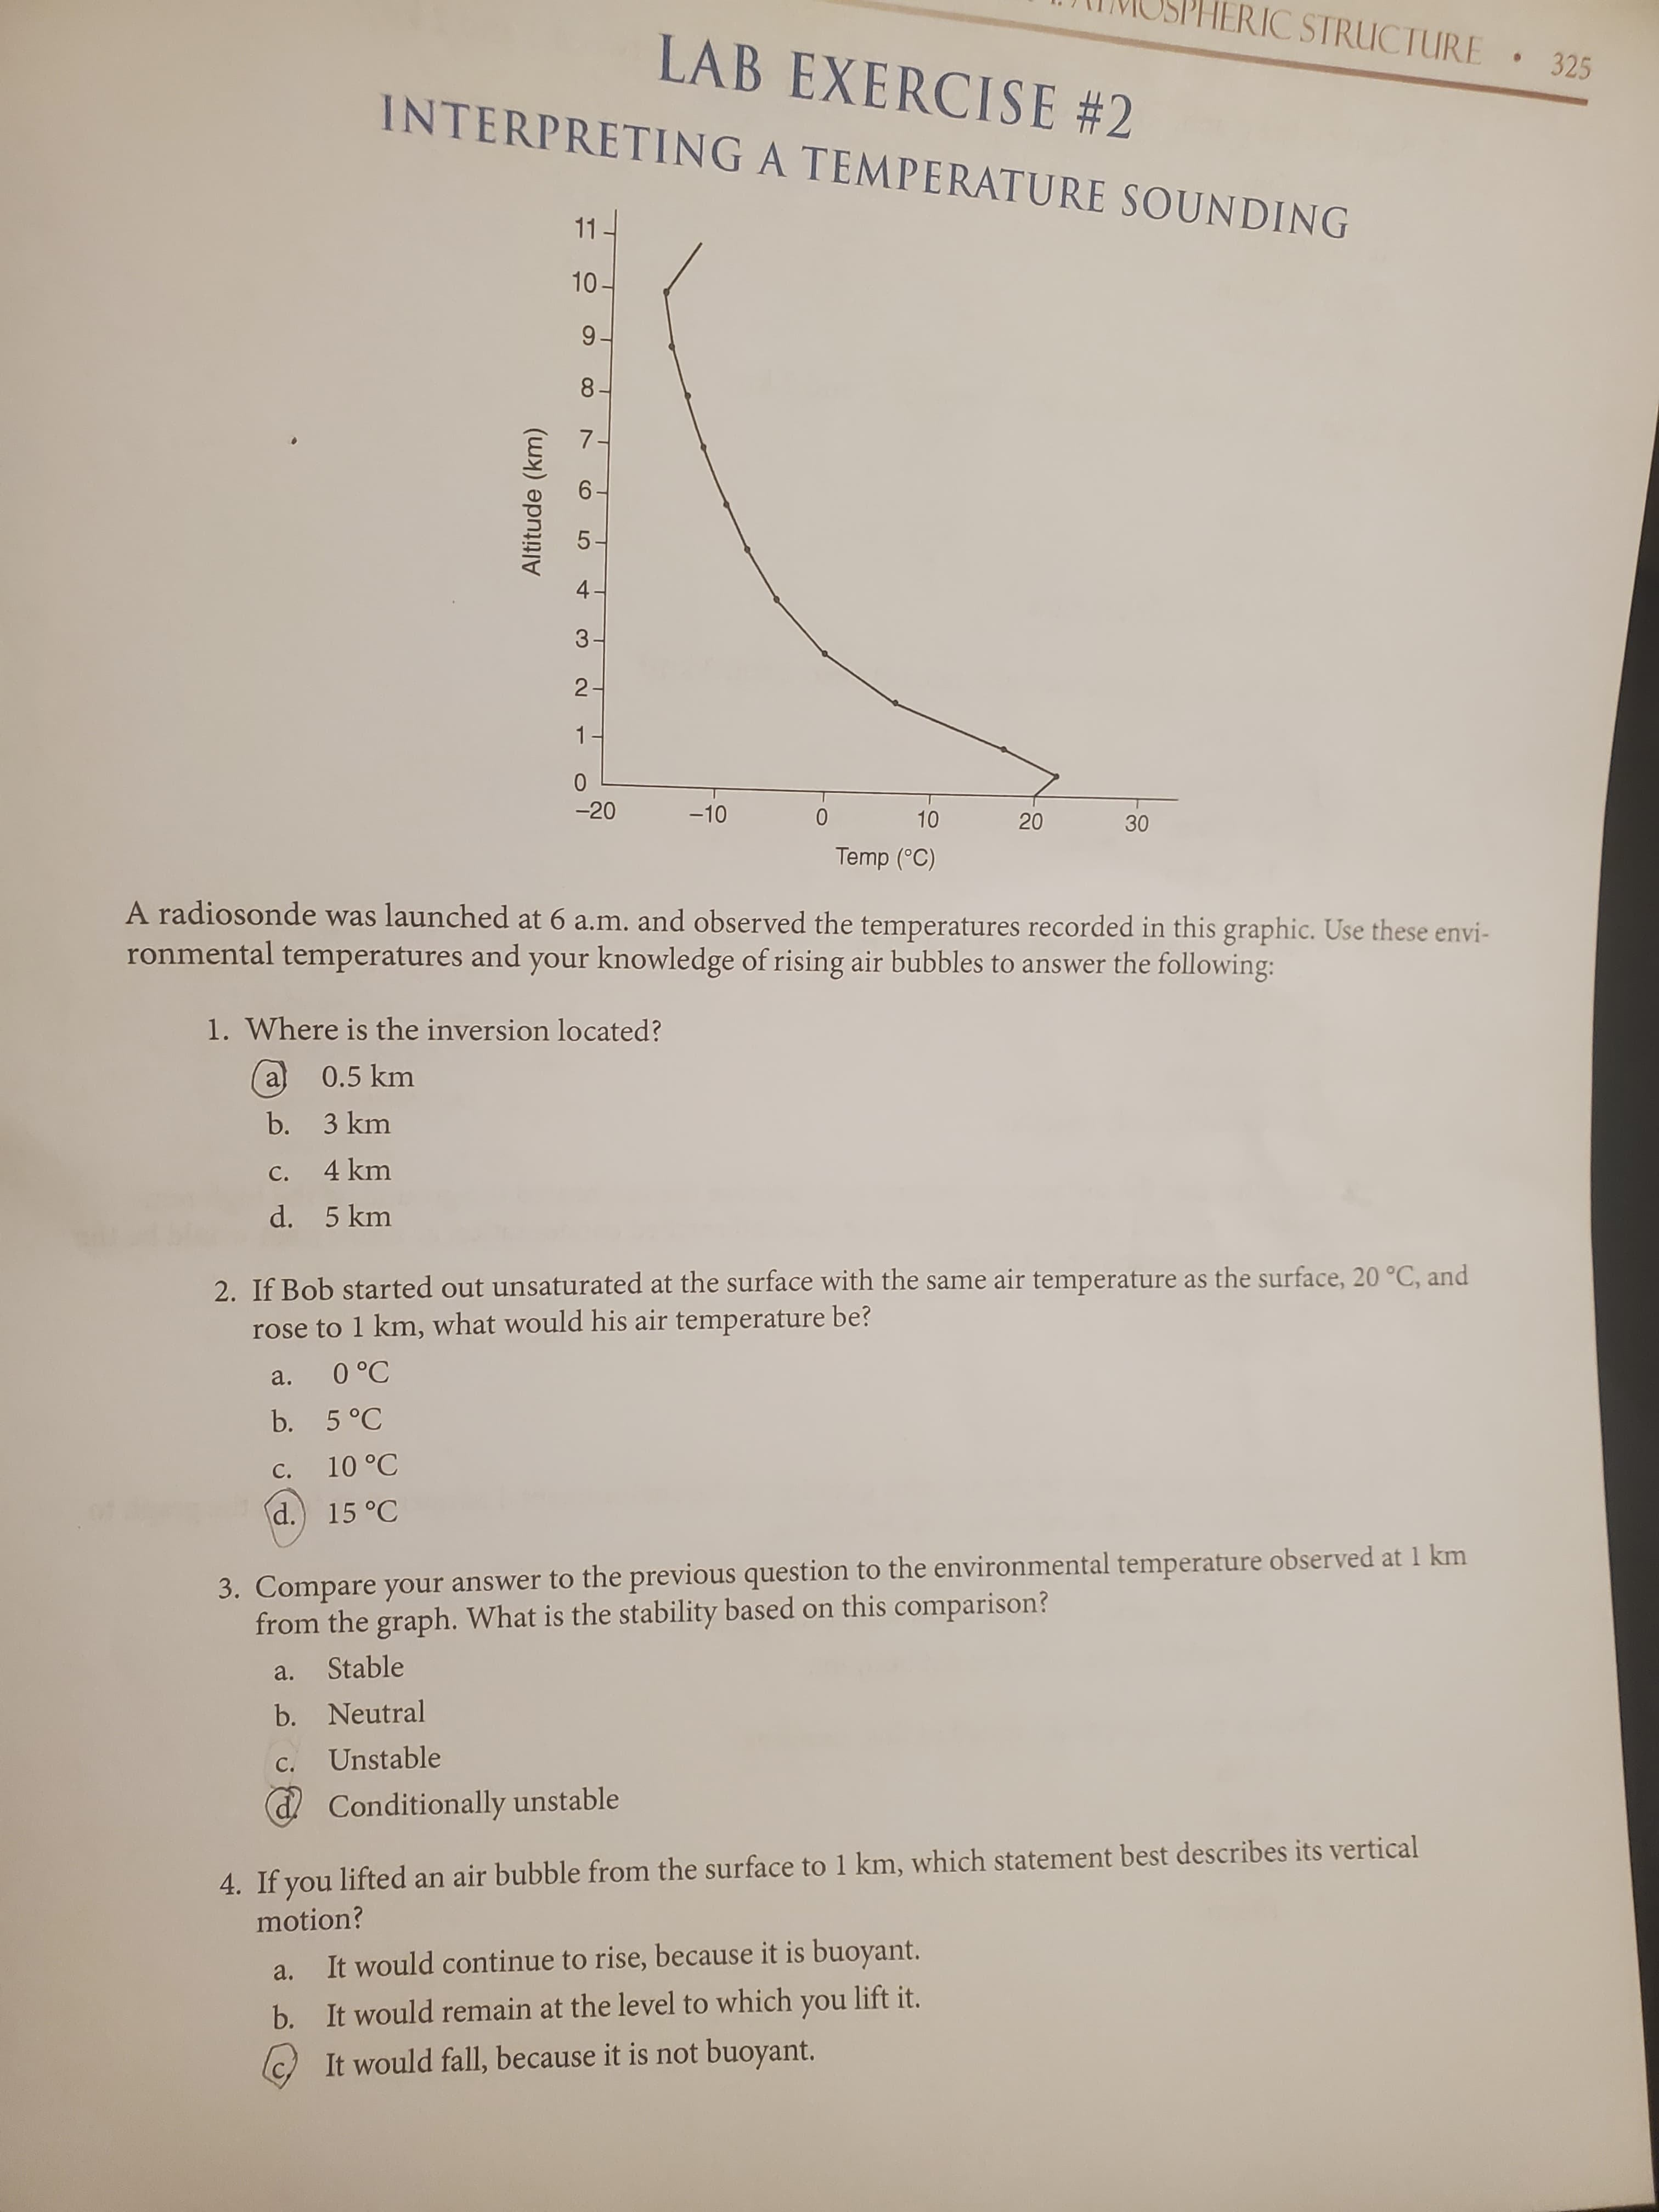
A radiosonde was launched at 6 a.m. and observed the temperatures recorded in this graphic. Use these envi-
ronmental temperatures and your knowledge of rising air bubbles to answer the following:
1. Where is the inversion located?
a
0.5 km
b. 3 km
c. 4 km
d. 5 km
2. If Bob started out unsaturated at the surface with the same air temperature as the surface, 20 °C, and
rose to 1 km, what would his air temperature be?
0°C
b. 5°C
a.
C.
d.) 15 °C
3. Compare your answer to the previous question to the environmental temperature observed at 1 km
from the graph. What is the stability based on this comparison?
a.
Stable
b. Neutral
Unstable
d Conditionally unstable
4. If you lifted an air bubble from the surface to 1 km, which statement best describes its vertical
motion?
a.
It would continue to rise, because it is buoyant.
b. It would remain at the level to which you lift it.
c) It would fall, because it is not buoyant.
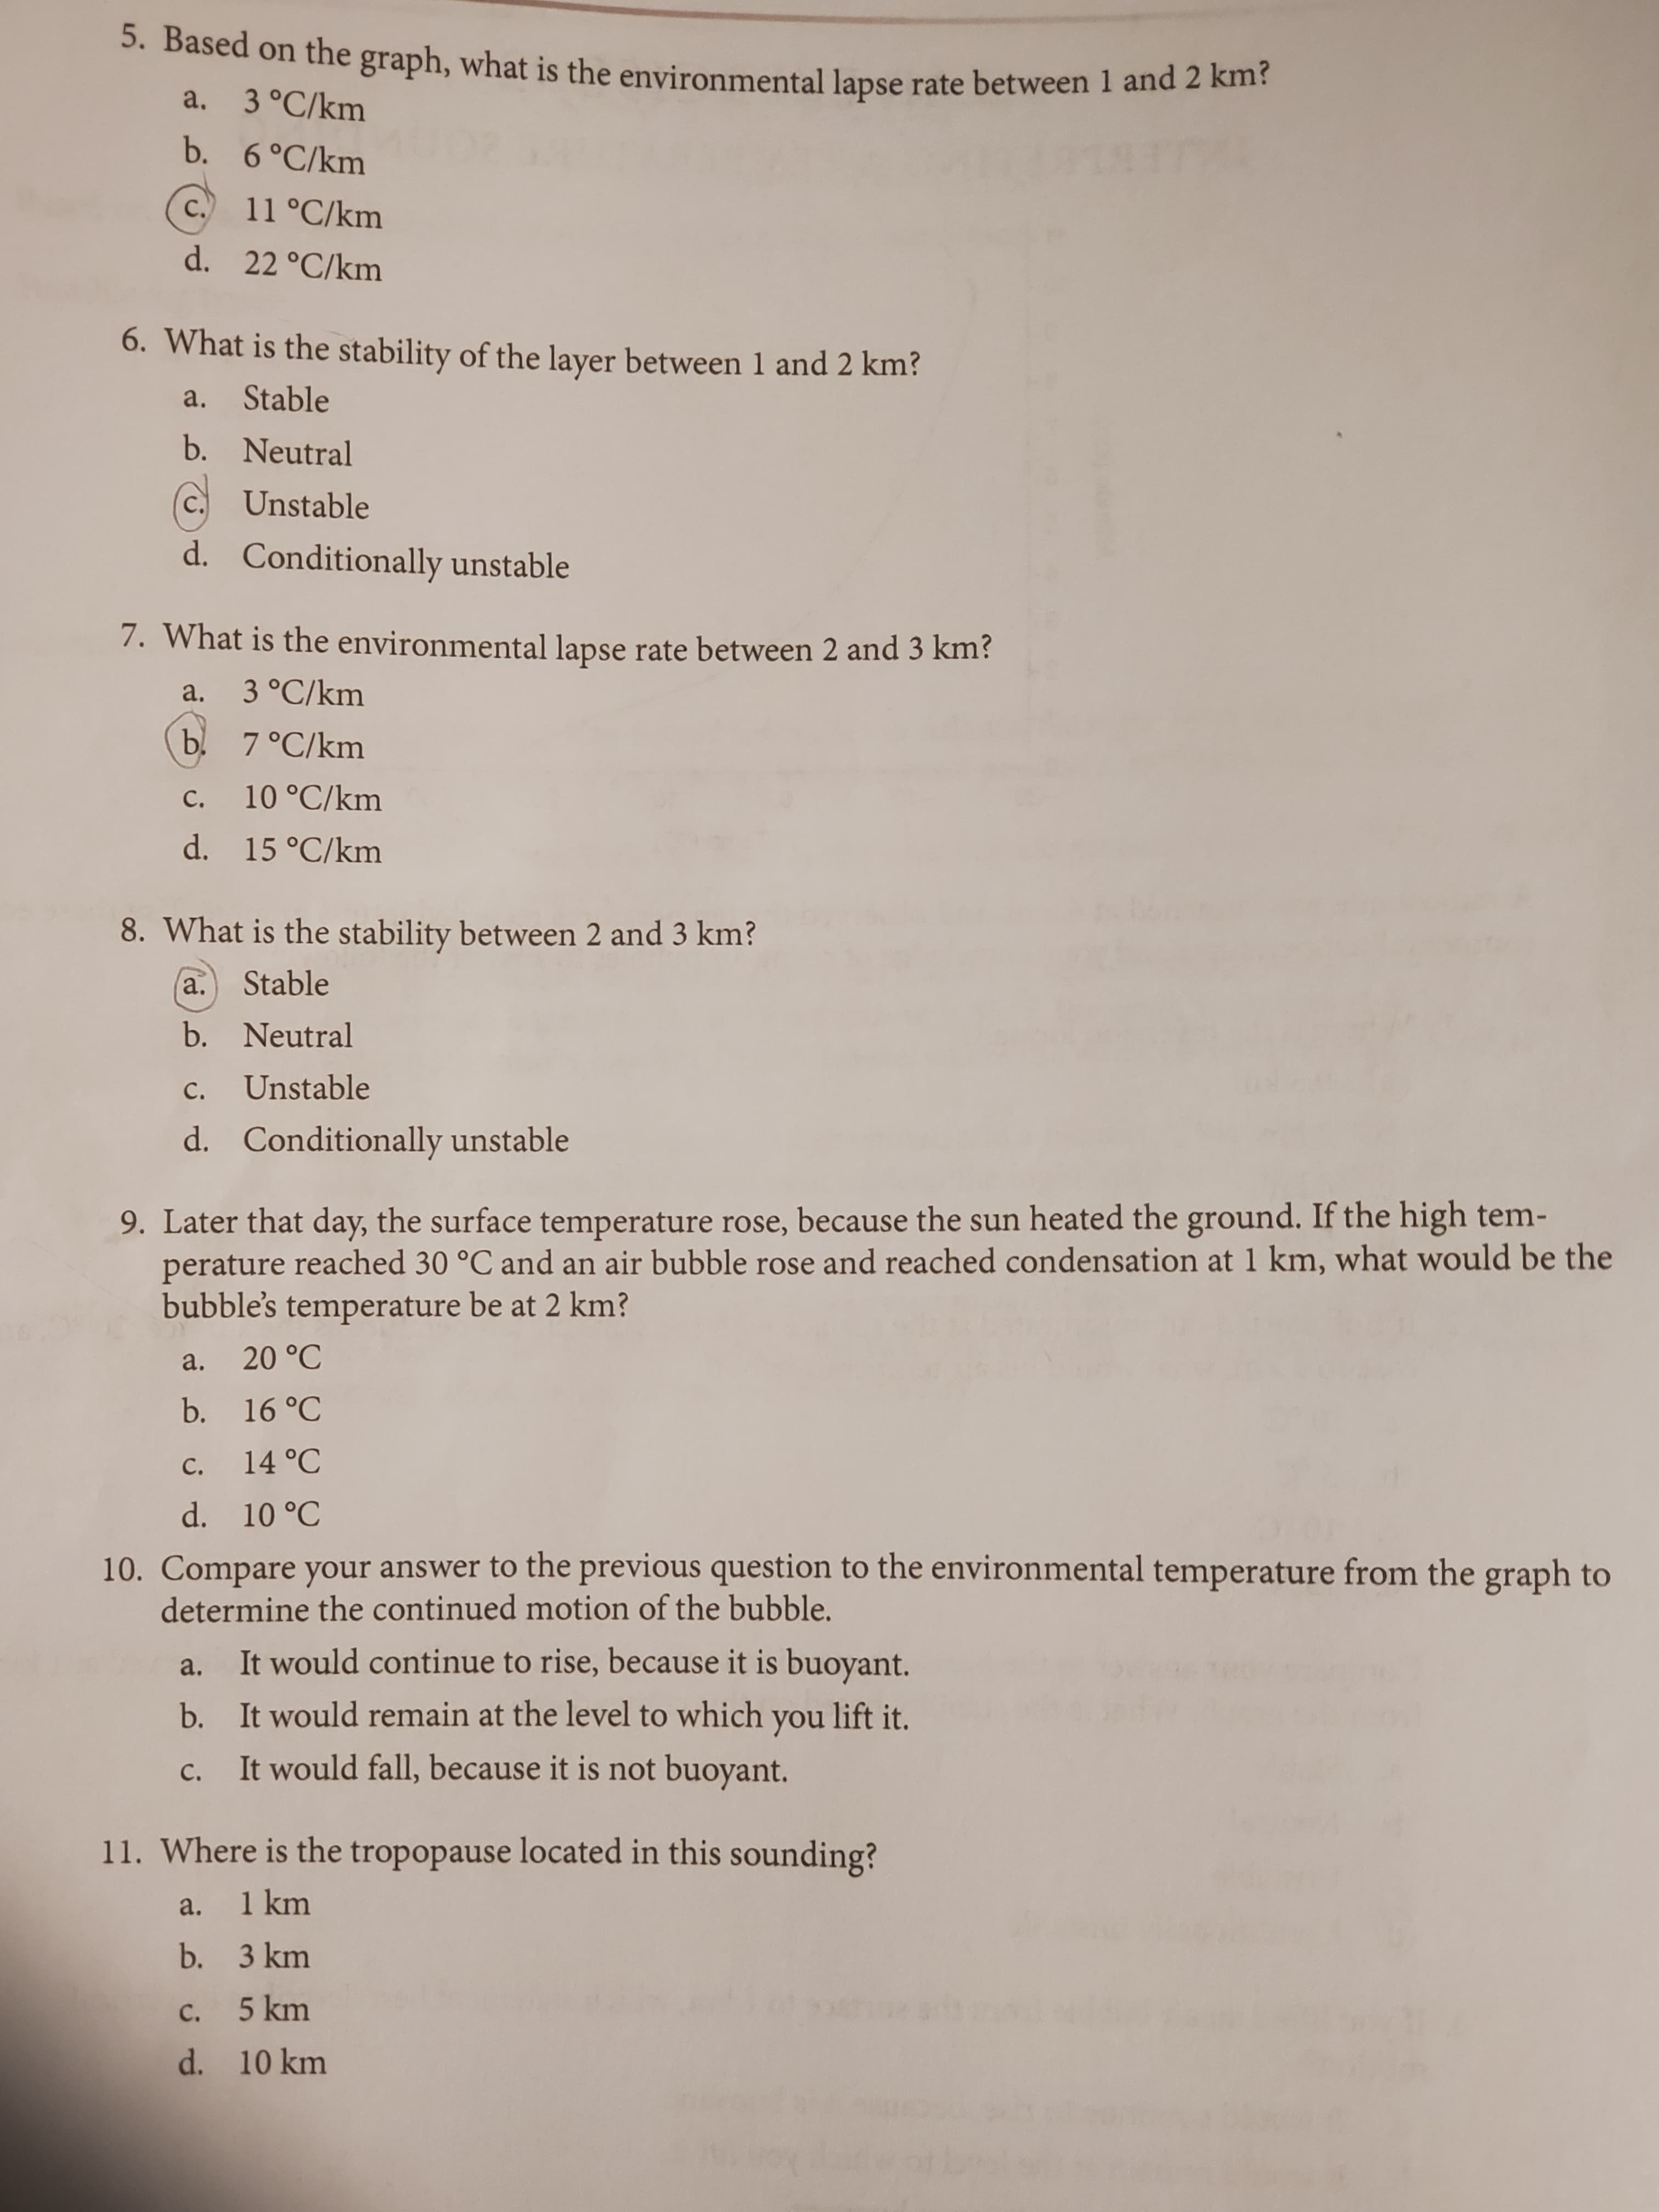
Transcribed Image Text:5. Based on the graph, what is the environmental lapse rate between 1 and 2 khi:
a. 3°C/km
b. 6°C/km
C.
11 °C/km
d. 22 °C/km
6. What is the stability of the layer between 1 and 2 km?
a. Stable
b. Neutral
C.
Unstable
d. Conditionally unstable
7. What is the environmental lapse rate between 2 and 3 km?
a.
3 °C/km
b 7°C/km
c. 10 °C/km
d. 15 °C/km
с.
8. What is the stability between 2 and 3 km?
a.
Stable
b. Neutral
с.
Unstable
d. Conditionally unstable
9. Later that day, the surface temperature rose, because the sun heated the ground. If the high tem-
perature reached 30 °C and an air bubble rose and reached condensation at 1 km, what would be the
bubble's temperature be at 2 km?
a. 20 °C
b. 16 °C
c. 14 °C
d. 10 °C
10. Compare your answer to the previous question to the environmental temperature from the graph to
determine the continued motion of the bubble.
It would continue to rise, because it is buoyant.
a.
b. It would remain at the level to which you lift it.
It would fall, because it is not buoyant.
с.
11. Where is the tropopause located in this sounding?
a.
1 km
b. 3 km
c. 5 km
d. 10 km
Expert Solution
This question has been solved!
Explore an expertly crafted, step-by-step solution for a thorough understanding of key concepts.

This is a popular solution!

Trending now
This is a popular solution!

Step by step
Solved in 2 steps

Recommended textbooks for you
Applications and Investigations in Earth Science …
Earth Science
ISBN:
9780134746241
Author:
Edward J. Tarbuck, Frederick K. Lutgens, Dennis G. Tasa
Publisher:
PEARSON

Exercises for Weather & Climate (9th Edition)
Earth Science
ISBN:
9780134041360
Author:
Greg Carbone
Publisher:
PEARSON

Environmental Science
Earth Science
ISBN:
9781260153125
Author:
William P Cunningham Prof., Mary Ann Cunningham Professor
Publisher:
McGraw-Hill Education
Applications and Investigations in Earth Science …
Earth Science
ISBN:
9780134746241
Author:
Edward J. Tarbuck, Frederick K. Lutgens, Dennis G. Tasa
Publisher:
PEARSON
Exercises for Weather & Climate (9th Edition)
Earth Science
ISBN:
9780134041360
Author:
Greg Carbone
Publisher:
PEARSON
Environmental Science
Earth Science
ISBN:
9781260153125
Author:
William P Cunningham Prof., Mary Ann Cunningham Professor
Publisher:
McGraw-Hill Education

Earth Science (15th Edition)
Earth Science
ISBN:
9780134543536
Author:
Edward J. Tarbuck, Frederick K. Lutgens, Dennis G. Tasa
Publisher:
PEARSON

Environmental Science (MindTap Course List)
Earth Science
ISBN:
9781337569613
Author:
G. Tyler Miller, Scott Spoolman
Publisher:
Cengage Learning

Physical Geology
Earth Science
ISBN:
9781259916823
Author:
Plummer, Charles C., CARLSON, Diane H., Hammersley, Lisa
Publisher:
Mcgraw-hill Education,