Freshwater Flux between Ocean and Atmosphere Figure 4A-1 is the climatological annual mean freshwater flux, or global distribution of evaporation (E) minus precipitation (P), or E – P in millimeter per day (mm/d) over ocean areas. The figure is from the Committee on Earth Observation satellites (2009) via NASA. -1. +6 +2 +1 +0.2 -0.2 -1 -2 4 -6 -8 -10 -13 -17 (mm/day) 3. The greatest positive values of E – P reflects a climate that is dominated by atmospheric surface circulation found in your textbook for assistance. Refer to the figure of the planetary-scale atmospheric a. polar easterlies above 60° latitude b. subtropical anticyclones centered near 30° latitude c. midlatitude westerlies between 30° and 60° latitude
Freshwater Flux between Ocean and Atmosphere Figure 4A-1 is the climatological annual mean freshwater flux, or global distribution of evaporation (E) minus precipitation (P), or E – P in millimeter per day (mm/d) over ocean areas. The figure is from the Committee on Earth Observation satellites (2009) via NASA. -1. +6 +2 +1 +0.2 -0.2 -1 -2 4 -6 -8 -10 -13 -17 (mm/day) 3. The greatest positive values of E – P reflects a climate that is dominated by atmospheric surface circulation found in your textbook for assistance. Refer to the figure of the planetary-scale atmospheric a. polar easterlies above 60° latitude b. subtropical anticyclones centered near 30° latitude c. midlatitude westerlies between 30° and 60° latitude

Applications and Investigations in Earth Science (9th Edition)
9th Edition
ISBN:9780134746241
Author:Edward J. Tarbuck, Frederick K. Lutgens, Dennis G. Tasa
Publisher:Edward J. Tarbuck, Frederick K. Lutgens, Dennis G. Tasa
Chapter1: The Study Of Minerals
Section: Chapter Questions
Problem 1LR

Related questions
Question
Transcribed Image Text:Freshwater Flux between Ocean and Atmosphere
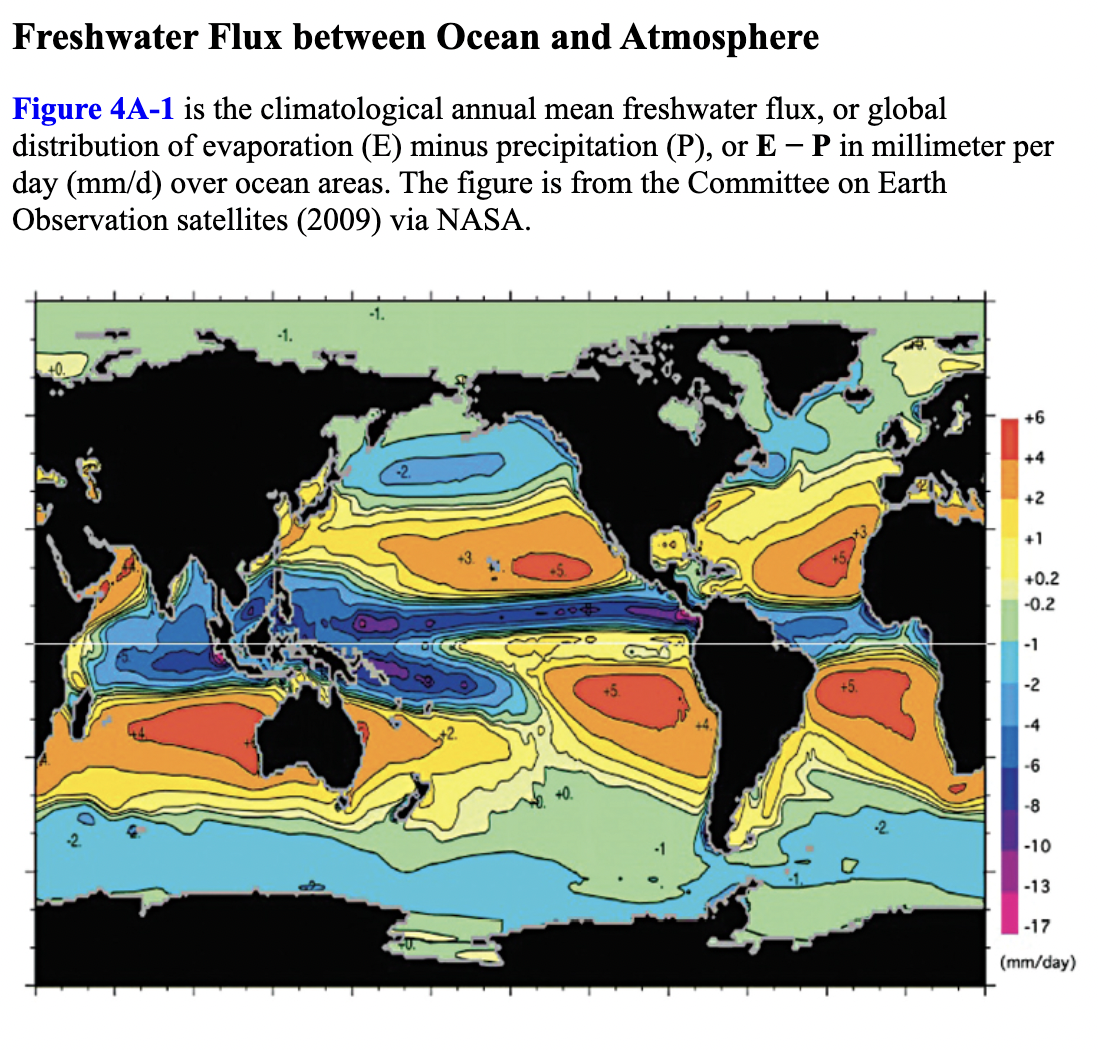
Figure 4A-1 is the climatological annual mean freshwater flux, or global
distribution of evaporation (E) minus precipitation (P), or E – P in millimeter per
day (mm/d) over ocean areas. The figure is from the Committee on Earth
Observation satellites (2009) via NASA.
-1.
+6
+2
+1
+0.2
-0.2
-1
-2
4
-6
-8
-10
-13
-17
(mm/day)
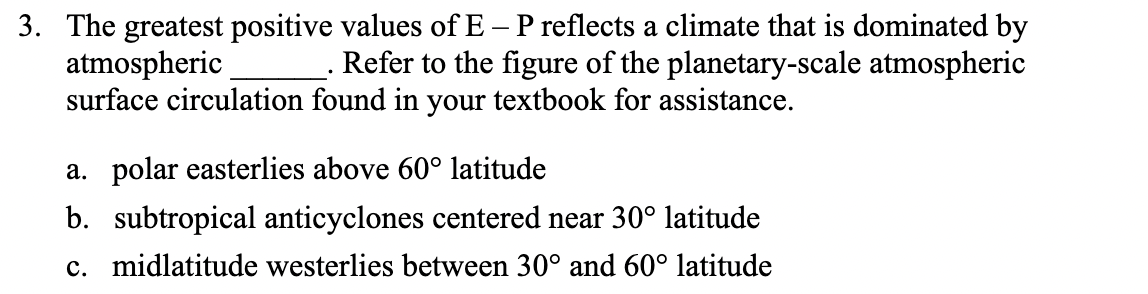
Transcribed Image Text:3. The greatest positive values of E – P reflects a climate that is dominated by
atmospheric
surface circulation found in your textbook for assistance.
Refer to the figure of the planetary-scale atmospheric
a. polar easterlies above 60° latitude
b. subtropical anticyclones centered near 30° latitude
c. midlatitude westerlies between 30° and 60° latitude
Expert Solution
This question has been solved!
Explore an expertly crafted, step-by-step solution for a thorough understanding of key concepts.

This is a popular solution!

Trending now
This is a popular solution!

Step by step
Solved in 3 steps

Recommended textbooks for you
Applications and Investigations in Earth Science …
Earth Science
ISBN:
9780134746241
Author:
Edward J. Tarbuck, Frederick K. Lutgens, Dennis G. Tasa
Publisher:
PEARSON

Exercises for Weather & Climate (9th Edition)
Earth Science
ISBN:
9780134041360
Author:
Greg Carbone
Publisher:
PEARSON

Environmental Science
Earth Science
ISBN:
9781260153125
Author:
William P Cunningham Prof., Mary Ann Cunningham Professor
Publisher:
McGraw-Hill Education
Applications and Investigations in Earth Science …
Earth Science
ISBN:
9780134746241
Author:
Edward J. Tarbuck, Frederick K. Lutgens, Dennis G. Tasa
Publisher:
PEARSON
Exercises for Weather & Climate (9th Edition)
Earth Science
ISBN:
9780134041360
Author:
Greg Carbone
Publisher:
PEARSON
Environmental Science
Earth Science
ISBN:
9781260153125
Author:
William P Cunningham Prof., Mary Ann Cunningham Professor
Publisher:
McGraw-Hill Education

Earth Science (15th Edition)
Earth Science
ISBN:
9780134543536
Author:
Edward J. Tarbuck, Frederick K. Lutgens, Dennis G. Tasa
Publisher:
PEARSON

Environmental Science (MindTap Course List)
Earth Science
ISBN:
9781337569613
Author:
G. Tyler Miller, Scott Spoolman
Publisher:
Cengage Learning

Physical Geology
Earth Science
ISBN:
9781259916823
Author:
Plummer, Charles C., CARLSON, Diane H., Hammersley, Lisa
Publisher:
Mcgraw-hill Education,