Exercises for Weather & Climate 0° O' N 78° 05' W Elev. 2811 m 70cm Quito, Ecuador Mountains and Highlands Air temperature at high elevations is typically cooler than at low elevations. At high elevations, air density is lower. With fewer greenhouse gas molecules (e.g., water vapor and carbon dioxide), long-wave radiation escapes to space Av.T: 14.4 Ann. P: 101.4 cm °C 40- 09- 35 30- more efficiently. 25 30 11. Examine Quito's climograph. How does Quito's temn- 20 15 perature curve reveal both its location in the tropics -10 10. (0°) and at high elevation (2811 m)? 5- JFMAMJJASOND Figure 14-14. Quito climograph. Mountains can also influence precipitation by modi- fying air flow. For example, in the mid-latitudes, where westerly winds predominate, mountain ranges that are Seattle, WA 47° 36' N 122° 20' W Elev. 6 m Av. T (°C): 10.7 Ann. P (cm): 98.9 °C 401 oriented in a north-south direction affect the temperature 70 cm and moisture characteristics of air flowing over them. Rising air on the windward flanks of a mountain range 09- 30- cools due to adiabatic expansion, producing clouds and 20. precipitation on the windward side. As air descends on the leeward side of mountains it warms adiabatically, thus 10- 30 0- -10 suppressing clouds and precipitation. The climatic con- trast between Seattle and Spokane, Washington, illustrates -20- 10 the influence of the Cascade Range in the northwestern United States. -30 J FMAMJ JASOND Figure 14-15. Seattle climograph. 12. Account for the difference in the annual temperature range between Seattle and Spokane. Spokane, WA 47° 39' N 117° 25' W Elev. 572 m Av. T (°C): 8.9 Ann. P (cm): 40.8 °C 40 70 cm 30- 09 - 20- 10- 13. Name two other cities that you suspect would have -30 0- contrasting temperature and precipitation patterns because they are separated by a mountain range. 20 -20- -30- JFMAMJJASOND Figure 14-16. Spokane climograph. Copyright 2016 Pearson Education, Inc.
Exercises for Weather & Climate 0° O' N 78° 05' W Elev. 2811 m 70cm Quito, Ecuador Mountains and Highlands Air temperature at high elevations is typically cooler than at low elevations. At high elevations, air density is lower. With fewer greenhouse gas molecules (e.g., water vapor and carbon dioxide), long-wave radiation escapes to space Av.T: 14.4 Ann. P: 101.4 cm °C 40- 09- 35 30- more efficiently. 25 30 11. Examine Quito's climograph. How does Quito's temn- 20 15 perature curve reveal both its location in the tropics -10 10. (0°) and at high elevation (2811 m)? 5- JFMAMJJASOND Figure 14-14. Quito climograph. Mountains can also influence precipitation by modi- fying air flow. For example, in the mid-latitudes, where westerly winds predominate, mountain ranges that are Seattle, WA 47° 36' N 122° 20' W Elev. 6 m Av. T (°C): 10.7 Ann. P (cm): 98.9 °C 401 oriented in a north-south direction affect the temperature 70 cm and moisture characteristics of air flowing over them. Rising air on the windward flanks of a mountain range 09- 30- cools due to adiabatic expansion, producing clouds and 20. precipitation on the windward side. As air descends on the leeward side of mountains it warms adiabatically, thus 10- 30 0- -10 suppressing clouds and precipitation. The climatic con- trast between Seattle and Spokane, Washington, illustrates -20- 10 the influence of the Cascade Range in the northwestern United States. -30 J FMAMJ JASOND Figure 14-15. Seattle climograph. 12. Account for the difference in the annual temperature range between Seattle and Spokane. Spokane, WA 47° 39' N 117° 25' W Elev. 572 m Av. T (°C): 8.9 Ann. P (cm): 40.8 °C 40 70 cm 30- 09 - 20- 10- 13. Name two other cities that you suspect would have -30 0- contrasting temperature and precipitation patterns because they are separated by a mountain range. 20 -20- -30- JFMAMJJASOND Figure 14-16. Spokane climograph. Copyright 2016 Pearson Education, Inc.

Applications and Investigations in Earth Science (9th Edition)
9th Edition
ISBN:9780134746241
Author:Edward J. Tarbuck, Frederick K. Lutgens, Dennis G. Tasa
Publisher:Edward J. Tarbuck, Frederick K. Lutgens, Dennis G. Tasa
Chapter1: The Study Of Minerals
Section: Chapter Questions
Problem 1LR

Related questions
Question
Transcribed Image Text:Exercises for Weather & Climate
0° O' N 78° 05' W Elev. 2811 m
70cm
Quito, Ecuador
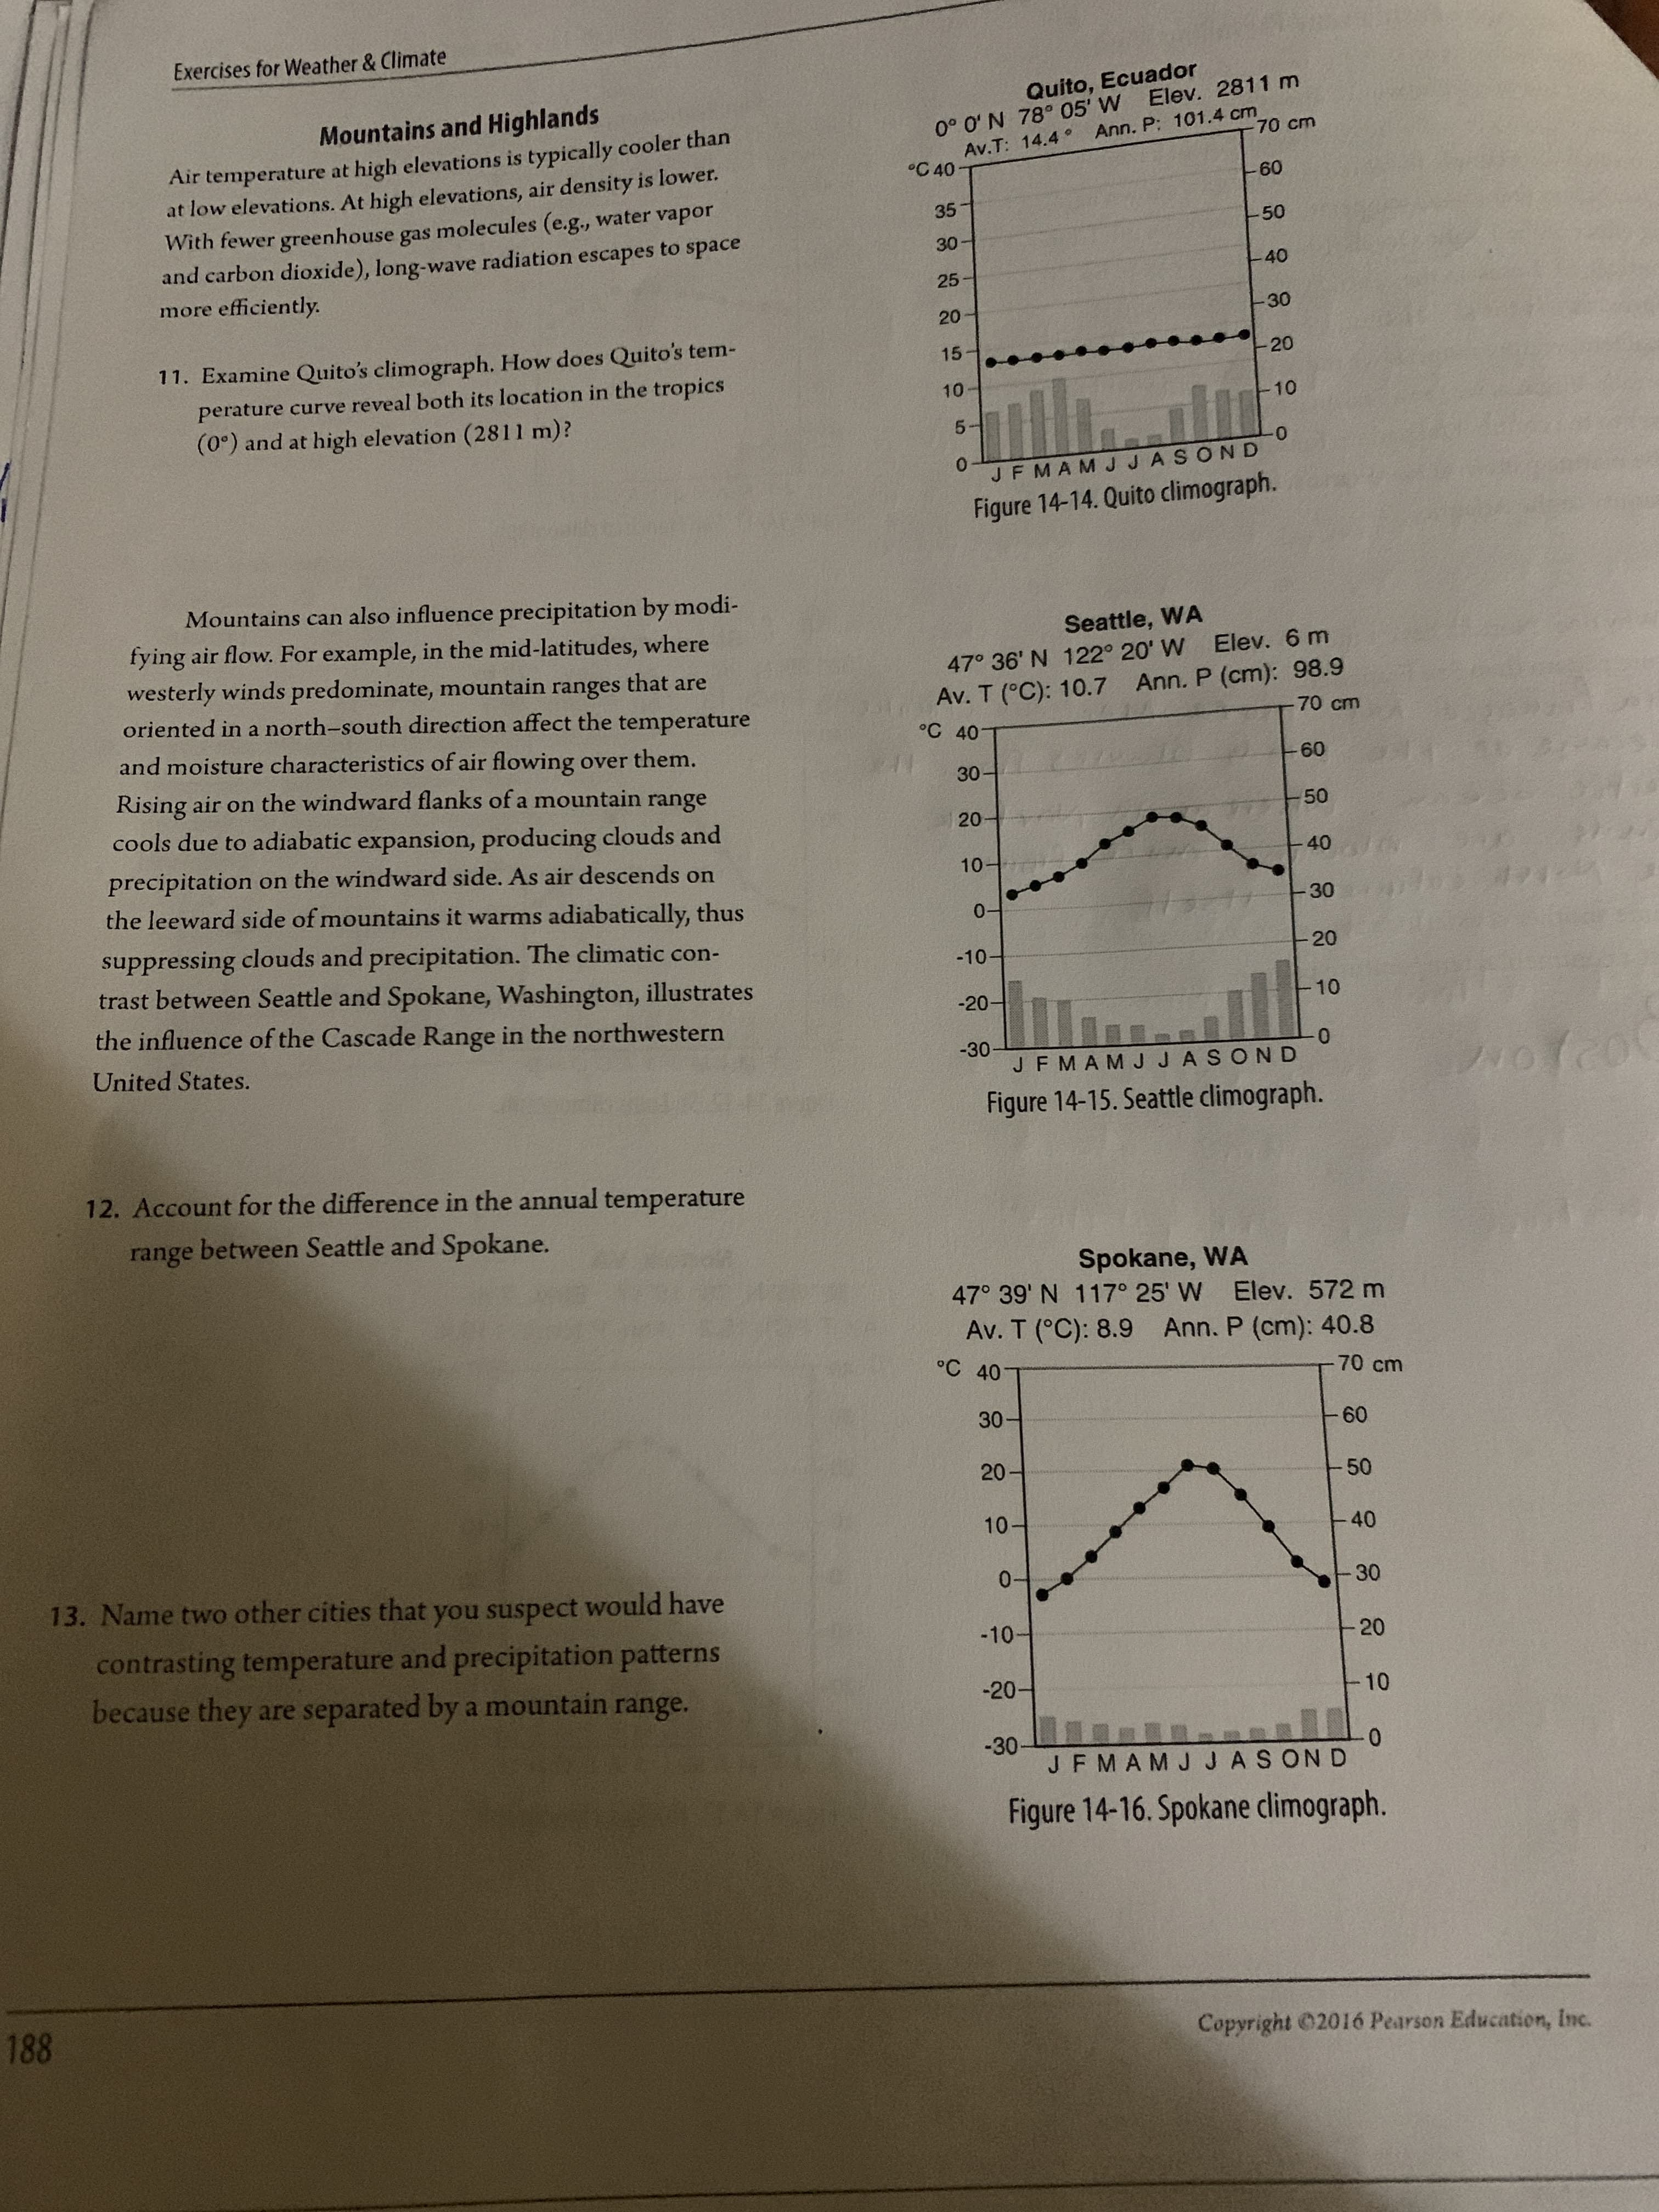
Mountains and Highlands
Air temperature at high elevations is typically cooler than
at low elevations. At high elevations, air density is lower.
With fewer greenhouse gas molecules (e.g., water vapor
and carbon dioxide), long-wave radiation escapes to space
Av.T: 14.4 Ann. P: 101.4 cm
°C 40-
09-
35
30-
more efficiently.
25
30
11. Examine Quito's climograph. How does Quito's temn-
20
15
perature curve reveal both its location in the tropics
-10
10.
(0°) and at high elevation (2811 m)?
5-
JFMAMJJASOND
Figure 14-14. Quito climograph.
Mountains can also influence precipitation by modi-
fying air flow. For example, in the mid-latitudes, where
westerly winds predominate, mountain ranges that are
Seattle, WA
47° 36' N 122° 20' W Elev. 6 m
Av. T (°C): 10.7 Ann. P (cm): 98.9
°C 401
oriented in a north-south direction affect the temperature
70 cm
and moisture characteristics of air flowing over them.
Rising air on the windward flanks of a mountain range
09-
30-
cools due to adiabatic expansion, producing clouds and
20.
precipitation on the windward side. As air descends on
the leeward side of mountains it warms adiabatically, thus
10-
30
0-
-10
suppressing clouds and precipitation. The climatic con-
trast between Seattle and Spokane, Washington, illustrates
-20-
10
the influence of the Cascade Range in the northwestern
United States.
-30
J FMAMJ JASOND
Figure 14-15. Seattle climograph.
12. Account for the difference in the annual temperature
range between Seattle and Spokane.
Spokane, WA
47° 39' N 117° 25' W Elev. 572 m
Av. T (°C): 8.9 Ann. P (cm): 40.8
°C 40
70 cm
30-
09 -
20-
10-
13. Name two other cities that you suspect would have
-30
0-
contrasting temperature and precipitation patterns
because they are separated by a mountain range.
20
-20-
-30-
JFMAMJJASOND
Figure 14-16. Spokane climograph.
Copyright 2016 Pearson Education, Inc.
Expert Solution
This question has been solved!
Explore an expertly crafted, step-by-step solution for a thorough understanding of key concepts.

This is a popular solution!

Trending now
This is a popular solution!

Step by step
Solved in 2 steps

Recommended textbooks for you
Applications and Investigations in Earth Science …
Earth Science
ISBN:
9780134746241
Author:
Edward J. Tarbuck, Frederick K. Lutgens, Dennis G. Tasa
Publisher:
PEARSON

Exercises for Weather & Climate (9th Edition)
Earth Science
ISBN:
9780134041360
Author:
Greg Carbone
Publisher:
PEARSON

Environmental Science
Earth Science
ISBN:
9781260153125
Author:
William P Cunningham Prof., Mary Ann Cunningham Professor
Publisher:
McGraw-Hill Education
Applications and Investigations in Earth Science …
Earth Science
ISBN:
9780134746241
Author:
Edward J. Tarbuck, Frederick K. Lutgens, Dennis G. Tasa
Publisher:
PEARSON
Exercises for Weather & Climate (9th Edition)
Earth Science
ISBN:
9780134041360
Author:
Greg Carbone
Publisher:
PEARSON
Environmental Science
Earth Science
ISBN:
9781260153125
Author:
William P Cunningham Prof., Mary Ann Cunningham Professor
Publisher:
McGraw-Hill Education

Earth Science (15th Edition)
Earth Science
ISBN:
9780134543536
Author:
Edward J. Tarbuck, Frederick K. Lutgens, Dennis G. Tasa
Publisher:
PEARSON

Environmental Science (MindTap Course List)
Earth Science
ISBN:
9781337569613
Author:
G. Tyler Miller, Scott Spoolman
Publisher:
Cengage Learning

Physical Geology
Earth Science
ISBN:
9781259916823
Author:
Plummer, Charles C., CARLSON, Diane H., Hammersley, Lisa
Publisher:
Mcgraw-hill Education,