Coriolis force ***** 1) Using an the the and the wind at E. Station Scence Lab Manual Use Figure 3 to anewer questions 1-7: 4) Which station is experiencing the strongest winds? 5) Which station is experiencing the lightest winds? wiaris the general flow of air around the high pressure system? (clockwise/counterclockwise) Wind direction B. H. Pressure gradient E. D 30.40 30.30 29.50 30.20 29.60 29.70 30.10 29.80 30.00 29.90 Figure 3: Map of the United States showing a typical high and a low pressure system. STATION MODELS Most of the weather data collected must be compiled into a form that can be readily depicted on a weather map. Due to the great volume of data which must be displayed, a set of "shorthand" codes and symbols have been devised to allow for the most effective data depiction (Figure 4). The data are plotted around a small circle used to represent the location of the station. The circle and its data are collectively referred to as a station model. The circle is used to depict cloud cover over the site. The current temperature is found to the left of the circle while the current dew point temperature is found to the Wind speed (mph) Wind direction Barometric Temperature (°F) pressure (inc 31 29.76 upper lower left. The current barometric pressure reading is found to the upper right of the circle. Wind direction is shown by a line pointed into the direction from which the wind is coming. Thus, a wind line pointing towards the north would represent a northerly wind. Barbs are placed on the wind line to indicate the current wind speed. Additional symbols are placed around the circle to depict precipitation, pressure tendency, cloud types, etc. +** Present weather Cloud cover Dew Point (F) Figure 4: The parts of a station model. S Figure 5 for a description of the symbols © 2008 Kendall Hunt Publishing Company and Brent Zaprowski Direction of motion 品 PRESENT WEATHER E Fog or ice fog WIND SPEED Calm Drizzle 30.05 Light rain -14 Moderate rain 15-20 29.36 21-25 Heavy rain 48 26-31 27 32-37 ** Light snow 29.76 38-43 ** Moderate snow 44-49 43 50-54 Station A ** Heavy snow 55-60 Station B 61-66 Station C Rain showers 67-71 72-77 Snow showers Temperature (°F) Station A 78-83 K Thunderstorm, with or without precipitation Station B Station C 84-89 Dew point (°F) Cloud cover (tenths) Wind speed (mph) CLOUD COVER No clouds One-tenth or less, not zero Wind direction Two-tenths to three-tenths Pressure (inches) Four-tenths Present weather Five-tenths Table 1: Weather station model data for question 8. Six-tenths 9) Which station has the highest relative humidity? How can you tell? Seven-tenths to eight-tenths Nine-tenths or overcast with openings Completely overcast 10) Which station is experiencing the heaviest precipitation at this time? Figure 5: Some of the symbols used in a typical station model. See Appendix 2 for a more complete listing. FRONTS Largely because of density differences (due to temperature and moisture differences), adjacent air masses do not readily mix with one another. Rather, they remain separated by boundaries known as fronts. Since they represent the boundaries between difering air masses, fronts are zones of rapid transition of temperature and/or moisture. This is part of the reason why fronts are such an important element of the weather. The next time you watch the weather on television count how many times the weather broadcaster says the word front! The two most common fronts are cold fronts and warm fronts. A cold front is depicted on a weather map by a line containing a series of triangles pointing in the direction toward which the front is moving (Figure 6). A warm front is shown by a line containing a series of semicircles, also pointing into the direction that the front is moving. Another type of front is the stationary front. A stationary front represents the boundary between two different air masses when neither air Warmer air Cold front Colder air Colder air Warm front Warmer air mass is advancing. A stationary front is shown on a map as a line with a series of alternating triangles and semicircles. The triangles point toward the warmer air mass and the semicircles point toward the cooler air mass. A stationary front will typically become either a warm front or a cold front once one of the air masses begins to Warmer air Stationary front Colder air advance. Figure 6: Frontal symbols used on weather maps. © 2008 Kendall Hunt Publishing Company and Brent Zaprowski 6-3
Coriolis force ***** 1) Using an the the and the wind at E. Station Scence Lab Manual Use Figure 3 to anewer questions 1-7: 4) Which station is experiencing the strongest winds? 5) Which station is experiencing the lightest winds? wiaris the general flow of air around the high pressure system? (clockwise/counterclockwise) Wind direction B. H. Pressure gradient E. D 30.40 30.30 29.50 30.20 29.60 29.70 30.10 29.80 30.00 29.90 Figure 3: Map of the United States showing a typical high and a low pressure system. STATION MODELS Most of the weather data collected must be compiled into a form that can be readily depicted on a weather map. Due to the great volume of data which must be displayed, a set of "shorthand" codes and symbols have been devised to allow for the most effective data depiction (Figure 4). The data are plotted around a small circle used to represent the location of the station. The circle and its data are collectively referred to as a station model. The circle is used to depict cloud cover over the site. The current temperature is found to the left of the circle while the current dew point temperature is found to the Wind speed (mph) Wind direction Barometric Temperature (°F) pressure (inc 31 29.76 upper lower left. The current barometric pressure reading is found to the upper right of the circle. Wind direction is shown by a line pointed into the direction from which the wind is coming. Thus, a wind line pointing towards the north would represent a northerly wind. Barbs are placed on the wind line to indicate the current wind speed. Additional symbols are placed around the circle to depict precipitation, pressure tendency, cloud types, etc. +** Present weather Cloud cover Dew Point (F) Figure 4: The parts of a station model. S Figure 5 for a description of the symbols © 2008 Kendall Hunt Publishing Company and Brent Zaprowski Direction of motion 品 PRESENT WEATHER E Fog or ice fog WIND SPEED Calm Drizzle 30.05 Light rain -14 Moderate rain 15-20 29.36 21-25 Heavy rain 48 26-31 27 32-37 ** Light snow 29.76 38-43 ** Moderate snow 44-49 43 50-54 Station A ** Heavy snow 55-60 Station B 61-66 Station C Rain showers 67-71 72-77 Snow showers Temperature (°F) Station A 78-83 K Thunderstorm, with or without precipitation Station B Station C 84-89 Dew point (°F) Cloud cover (tenths) Wind speed (mph) CLOUD COVER No clouds One-tenth or less, not zero Wind direction Two-tenths to three-tenths Pressure (inches) Four-tenths Present weather Five-tenths Table 1: Weather station model data for question 8. Six-tenths 9) Which station has the highest relative humidity? How can you tell? Seven-tenths to eight-tenths Nine-tenths or overcast with openings Completely overcast 10) Which station is experiencing the heaviest precipitation at this time? Figure 5: Some of the symbols used in a typical station model. See Appendix 2 for a more complete listing. FRONTS Largely because of density differences (due to temperature and moisture differences), adjacent air masses do not readily mix with one another. Rather, they remain separated by boundaries known as fronts. Since they represent the boundaries between difering air masses, fronts are zones of rapid transition of temperature and/or moisture. This is part of the reason why fronts are such an important element of the weather. The next time you watch the weather on television count how many times the weather broadcaster says the word front! The two most common fronts are cold fronts and warm fronts. A cold front is depicted on a weather map by a line containing a series of triangles pointing in the direction toward which the front is moving (Figure 6). A warm front is shown by a line containing a series of semicircles, also pointing into the direction that the front is moving. Another type of front is the stationary front. A stationary front represents the boundary between two different air masses when neither air Warmer air Cold front Colder air Colder air Warm front Warmer air mass is advancing. A stationary front is shown on a map as a line with a series of alternating triangles and semicircles. The triangles point toward the warmer air mass and the semicircles point toward the cooler air mass. A stationary front will typically become either a warm front or a cold front once one of the air masses begins to Warmer air Stationary front Colder air advance. Figure 6: Frontal symbols used on weather maps. © 2008 Kendall Hunt Publishing Company and Brent Zaprowski 6-3

Applications and Investigations in Earth Science (9th Edition)
9th Edition
ISBN:9780134746241
Author:Edward J. Tarbuck, Frederick K. Lutgens, Dennis G. Tasa
Publisher:Edward J. Tarbuck, Frederick K. Lutgens, Dennis G. Tasa
Chapter1: The Study Of Minerals
Section: Chapter Questions
Problem 1LR

Related questions
Question
Transcribed Image Text:Coriolis force
*****
1) Using an the the and the wind at E. Station
Scence Lab Manual
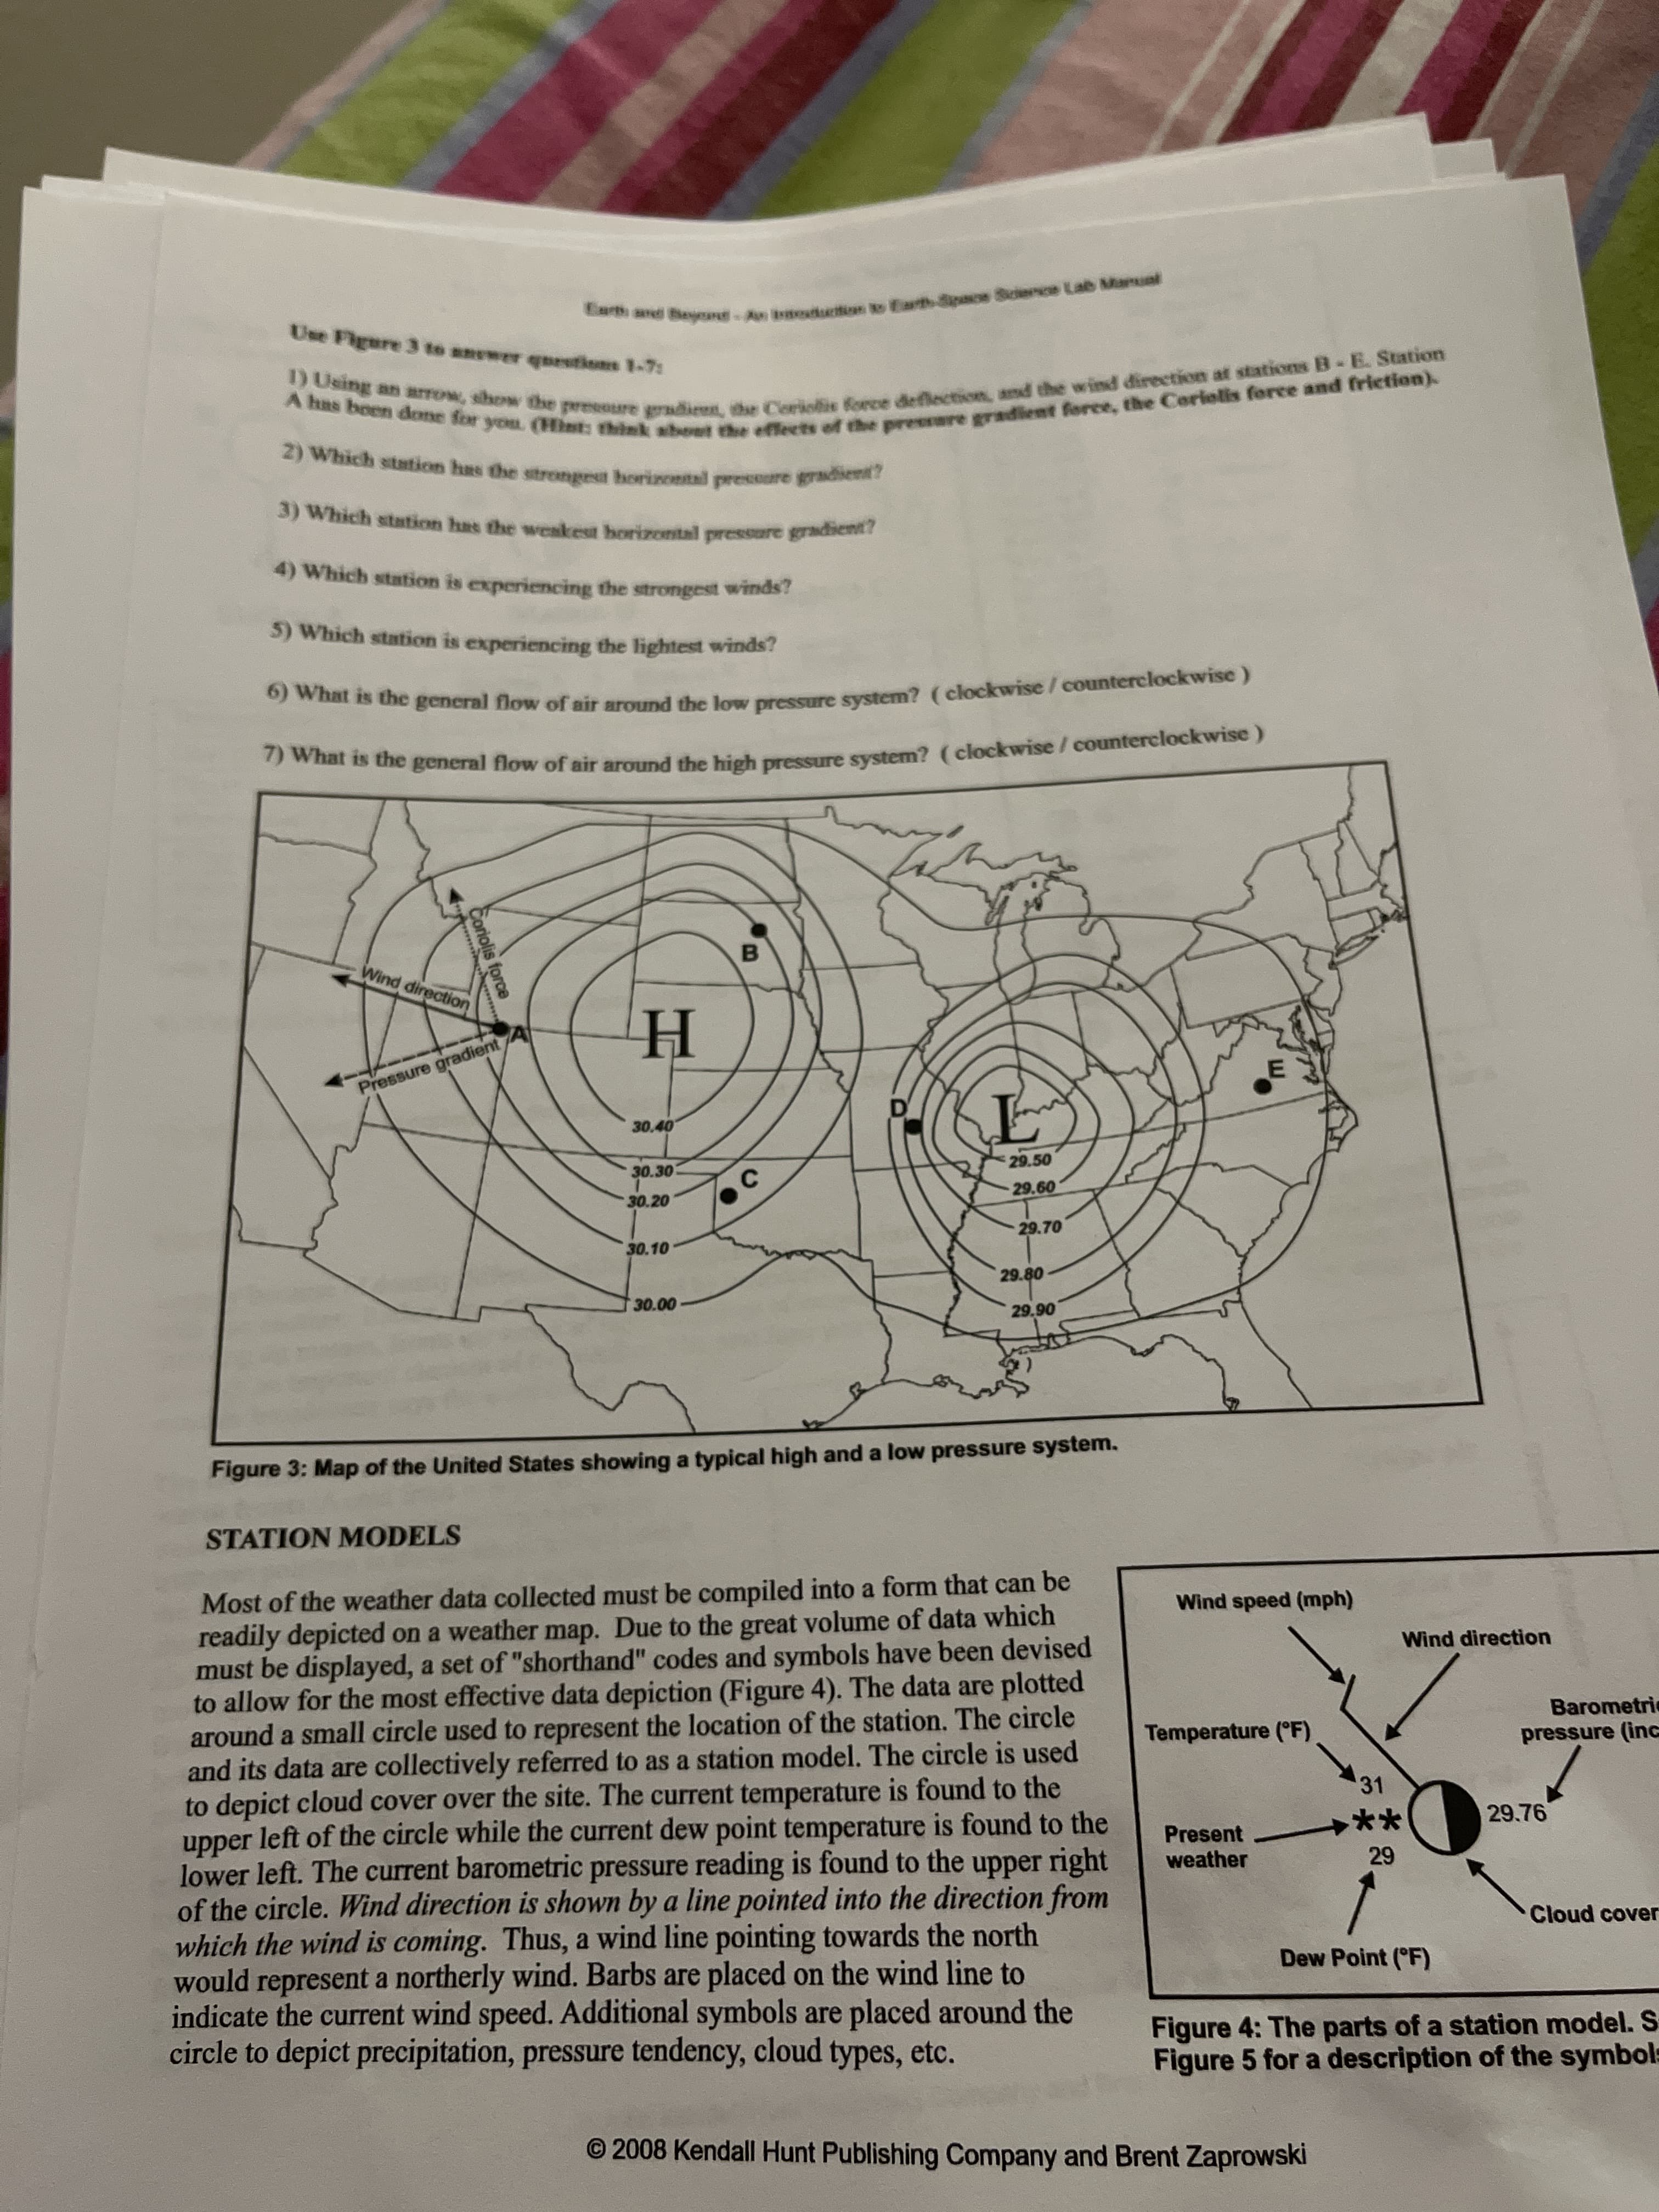
Use Figure 3 to anewer questions 1-7:
4) Which station is experiencing the strongest winds?
5) Which station is experiencing the lightest winds?
wiaris the general flow of air around the high pressure system? (clockwise/counterclockwise)
Wind direction
B.
H.
Pressure gradient
E.
D
30.40
30.30
29.50
30.20
29.60
29.70
30.10
29.80
30.00
29.90
Figure 3: Map of the United States showing a typical high and a low pressure system.
STATION MODELS
Most of the weather data collected must be compiled into a form that can be
readily depicted on a weather map. Due to the great volume of data which
must be displayed, a set of "shorthand" codes and symbols have been devised
to allow for the most effective data depiction (Figure 4). The data are plotted
around a small circle used to represent the location of the station. The circle
and its data are collectively referred to as a station model. The circle is used
to depict cloud cover over the site. The current temperature is found to the
left of the circle while the current dew point temperature is found to the
Wind speed (mph)
Wind direction
Barometric
Temperature (°F)
pressure (inc
31
29.76
upper
lower left. The current barometric pressure reading is found to the upper right
of the circle. Wind direction is shown by a line pointed into the direction from
which the wind is coming. Thus, a wind line pointing towards the north
would represent a northerly wind. Barbs are placed on the wind line to
indicate the current wind speed. Additional symbols are placed around the
circle to depict precipitation, pressure tendency, cloud types, etc.
+**
Present
weather
Cloud cover
Dew Point (F)
Figure 4: The parts of a station model. S
Figure 5 for a description of the symbols
© 2008 Kendall Hunt Publishing Company and Brent Zaprowski
Transcribed Image Text:Direction of motion
品
PRESENT WEATHER
E Fog or ice fog
WIND SPEED
Calm
Drizzle
30.05
Light rain
-14
Moderate rain
15-20
29.36
21-25
Heavy rain
48
26-31
27
32-37
** Light snow
29.76
38-43
** Moderate snow
44-49
43
50-54
Station A
** Heavy snow
55-60
Station B
61-66
Station C
Rain showers
67-71
72-77
Snow showers
Temperature (°F)
Station A
78-83
K Thunderstorm, with
or without precipitation
Station B
Station C
84-89
Dew point (°F)
Cloud cover (tenths)
Wind speed (mph)
CLOUD COVER
No clouds
One-tenth or less, not zero
Wind direction
Two-tenths to three-tenths
Pressure (inches)
Four-tenths
Present weather
Five-tenths
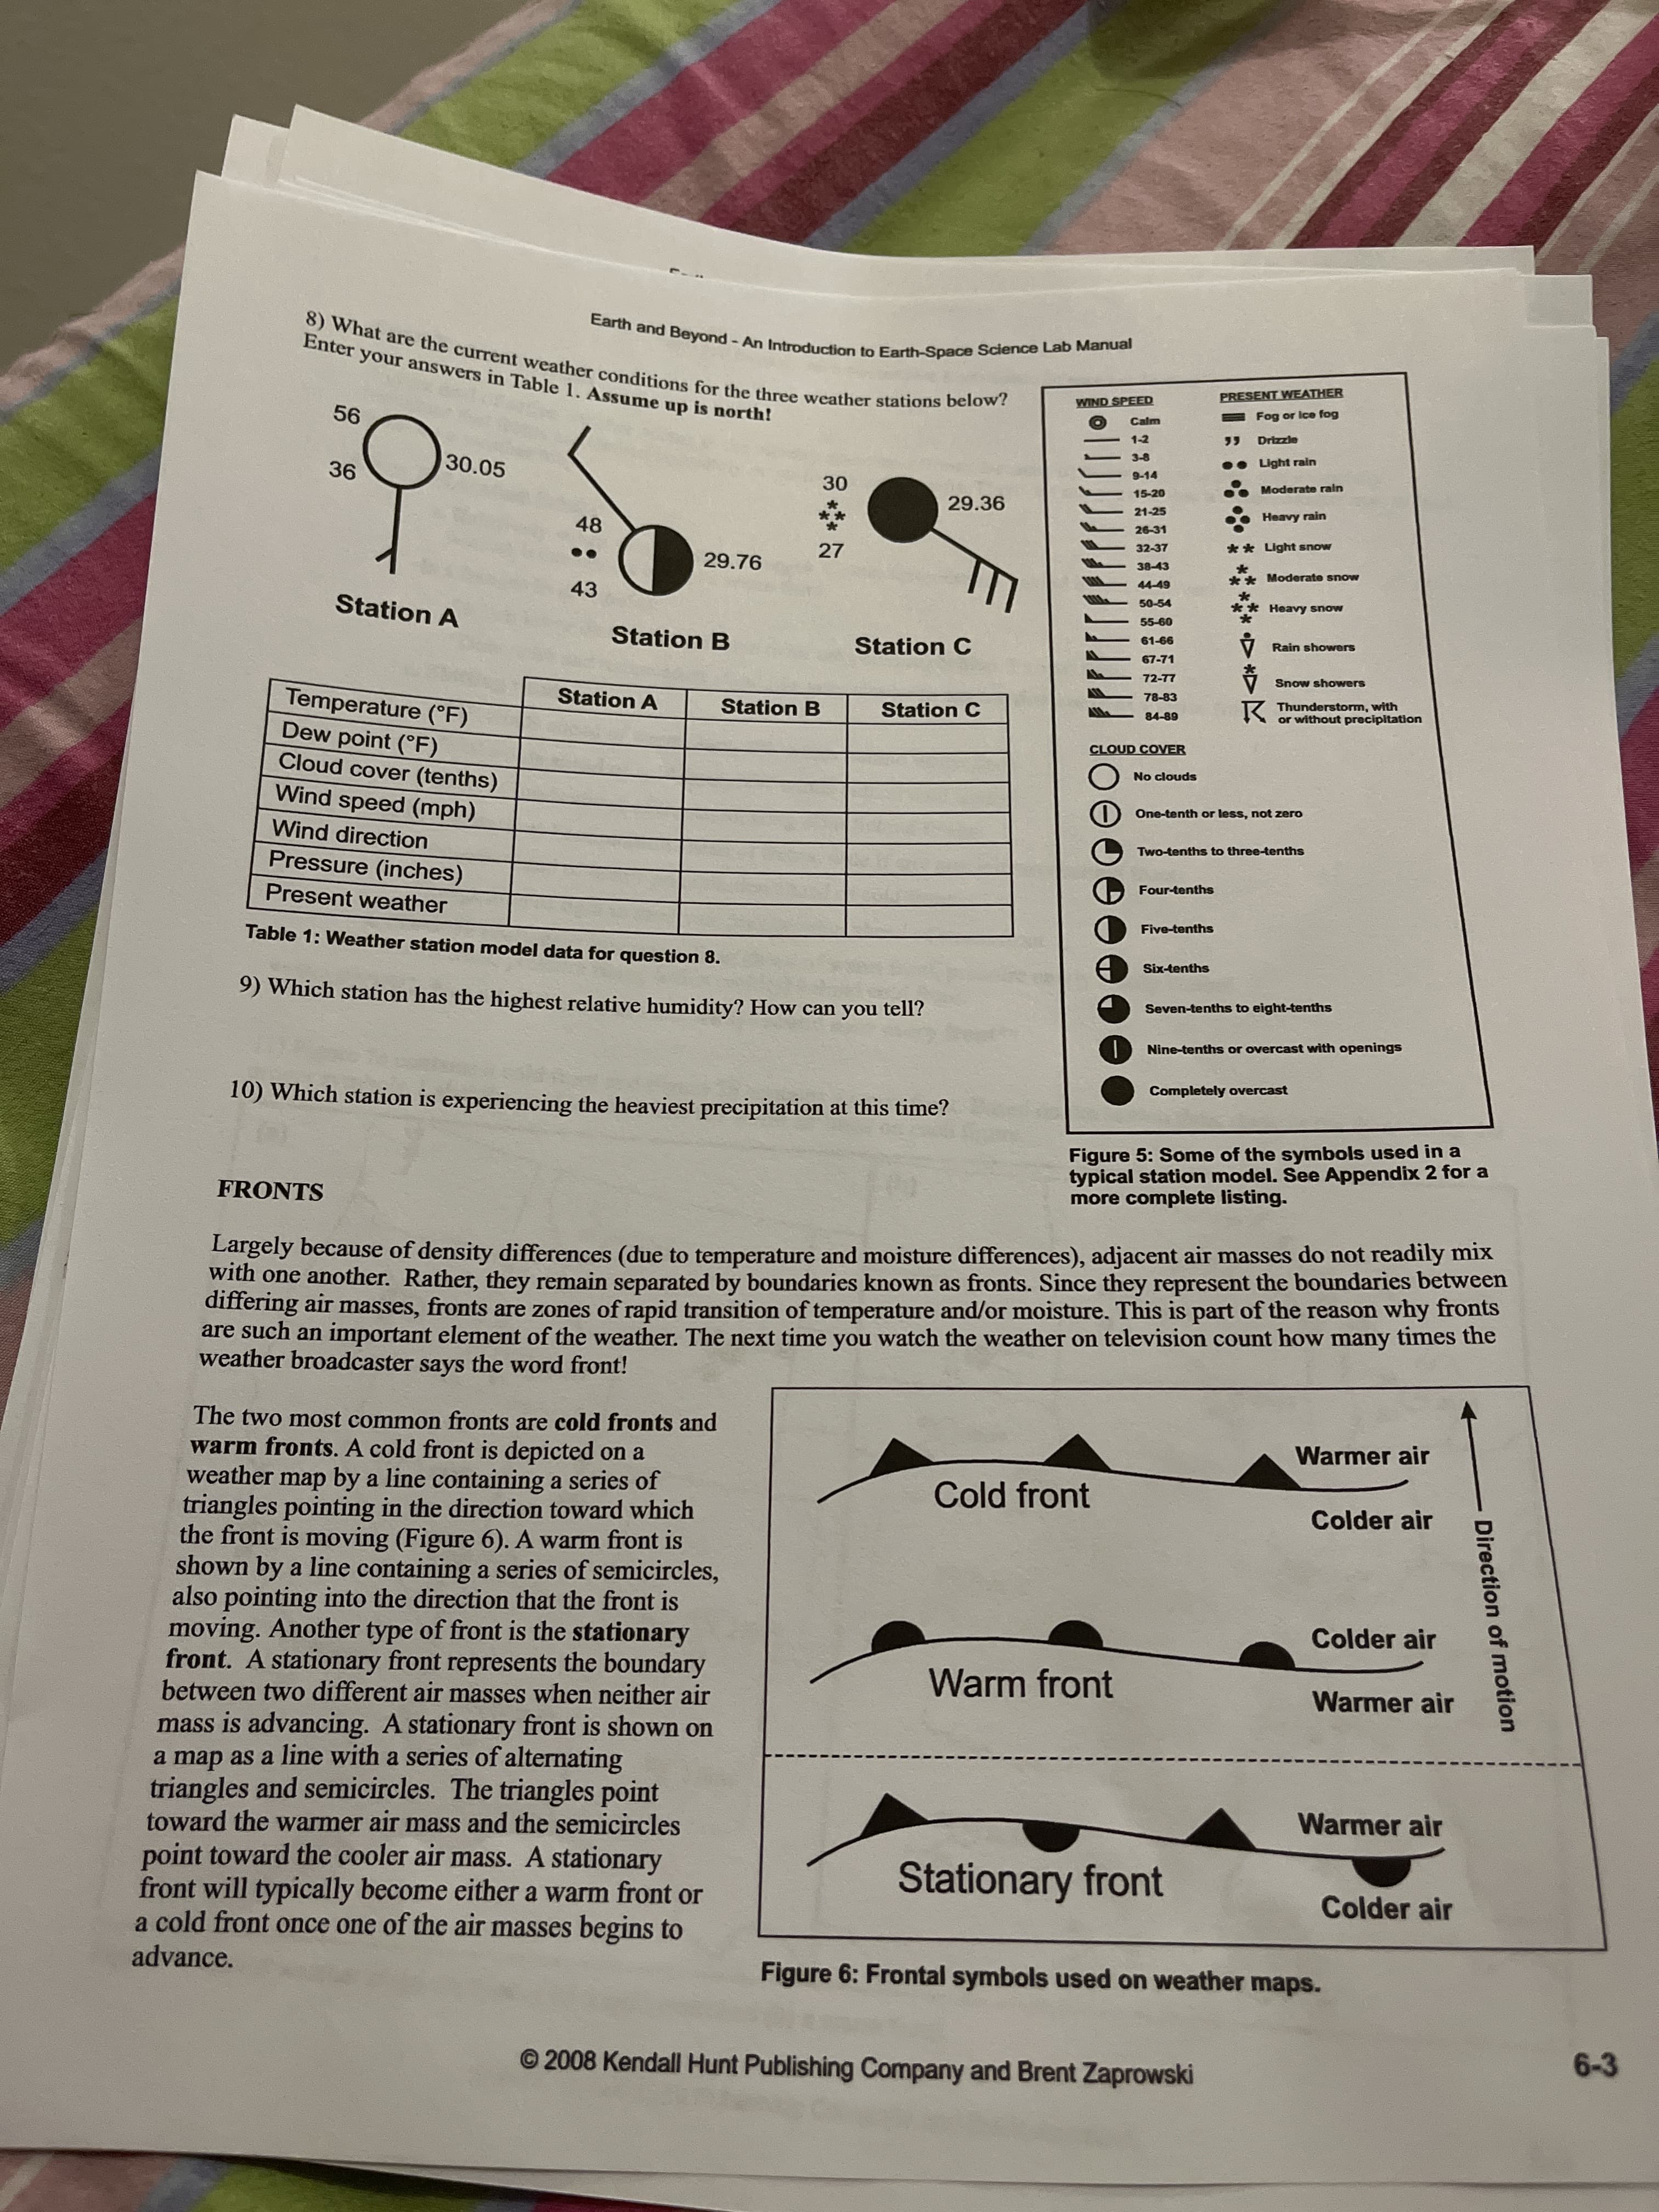
Table 1: Weather station model data for question 8.
Six-tenths
9) Which station has the highest relative humidity? How can you tell?
Seven-tenths to eight-tenths
Nine-tenths or overcast with openings
Completely overcast
10) Which station is experiencing the heaviest precipitation at this time?
Figure 5: Some of the symbols used in a
typical station model. See Appendix 2 for a
more complete listing.
FRONTS
Largely because of density differences (due to temperature and moisture differences), adjacent air masses do not readily mix
with one another. Rather, they remain separated by boundaries known as fronts. Since they represent the boundaries between
difering air masses, fronts are zones of rapid transition of temperature and/or moisture. This is part of the reason why fronts
are such an important element of the weather. The next time you watch the weather on television count how many times the
weather broadcaster says the word front!
The two most common fronts are cold fronts and
warm fronts. A cold front is depicted on a
weather map by a line containing a series of
triangles pointing in the direction toward which
the front is moving (Figure 6). A warm front is
shown by a line containing a series of semicircles,
also pointing into the direction that the front is
moving. Another type of front is the stationary
front. A stationary front represents the boundary
between two different air masses when neither air
Warmer air
Cold front
Colder air
Colder air
Warm front
Warmer air
mass is advancing. A stationary front is shown on
a map as a line with a series of alternating
triangles and semicircles. The triangles point
toward the warmer air mass and the semicircles
point toward the cooler air mass. A stationary
front will typically become either a warm front or
a cold front once one of the air masses begins to
Warmer air
Stationary front
Colder air
advance.
Figure 6: Frontal symbols used on weather maps.
© 2008 Kendall Hunt Publishing Company and Brent Zaprowski
6-3
Expert Solution
This question has been solved!
Explore an expertly crafted, step-by-step solution for a thorough understanding of key concepts.

This is a popular solution!

Trending now
This is a popular solution!

Step by step
Solved in 2 steps with 1 images

Recommended textbooks for you
Applications and Investigations in Earth Science …
Earth Science
ISBN:
9780134746241
Author:
Edward J. Tarbuck, Frederick K. Lutgens, Dennis G. Tasa
Publisher:
PEARSON

Exercises for Weather & Climate (9th Edition)
Earth Science
ISBN:
9780134041360
Author:
Greg Carbone
Publisher:
PEARSON

Environmental Science
Earth Science
ISBN:
9781260153125
Author:
William P Cunningham Prof., Mary Ann Cunningham Professor
Publisher:
McGraw-Hill Education
Applications and Investigations in Earth Science …
Earth Science
ISBN:
9780134746241
Author:
Edward J. Tarbuck, Frederick K. Lutgens, Dennis G. Tasa
Publisher:
PEARSON
Exercises for Weather & Climate (9th Edition)
Earth Science
ISBN:
9780134041360
Author:
Greg Carbone
Publisher:
PEARSON
Environmental Science
Earth Science
ISBN:
9781260153125
Author:
William P Cunningham Prof., Mary Ann Cunningham Professor
Publisher:
McGraw-Hill Education

Earth Science (15th Edition)
Earth Science
ISBN:
9780134543536
Author:
Edward J. Tarbuck, Frederick K. Lutgens, Dennis G. Tasa
Publisher:
PEARSON

Environmental Science (MindTap Course List)
Earth Science
ISBN:
9781337569613
Author:
G. Tyler Miller, Scott Spoolman
Publisher:
Cengage Learning

Physical Geology
Earth Science
ISBN:
9781259916823
Author:
Plummer, Charles C., CARLSON, Diane H., Hammersley, Lisa
Publisher:
Mcgraw-hill Education,