Price (dollars per pizza) S S2 9. Quantity (millions of pizzas per year) In the above figure, the movement from point a to point b reflects J A) an increase in the price of pizza. B) an increase in the number of producers of pizza. C) an increase in the supply of pizza. D) a decrease in income if pizza is a normal good. E) a decrease in the cost of the tomato sauce used to produce pizza.
Price (dollars per pizza) S S2 9. Quantity (millions of pizzas per year) In the above figure, the movement from point a to point b reflects J A) an increase in the price of pizza. B) an increase in the number of producers of pizza. C) an increase in the supply of pizza. D) a decrease in income if pizza is a normal good. E) a decrease in the cost of the tomato sauce used to produce pizza.

Principles of Macroeconomics (MindTap Course List)
7th Edition
ISBN:9781285165912
Author:N. Gregory Mankiw
Publisher:N. Gregory Mankiw
Chapter11: Measuring The Cost Of Living
Section: Chapter Questions
Problem 3PA

Related questions
Question
100%
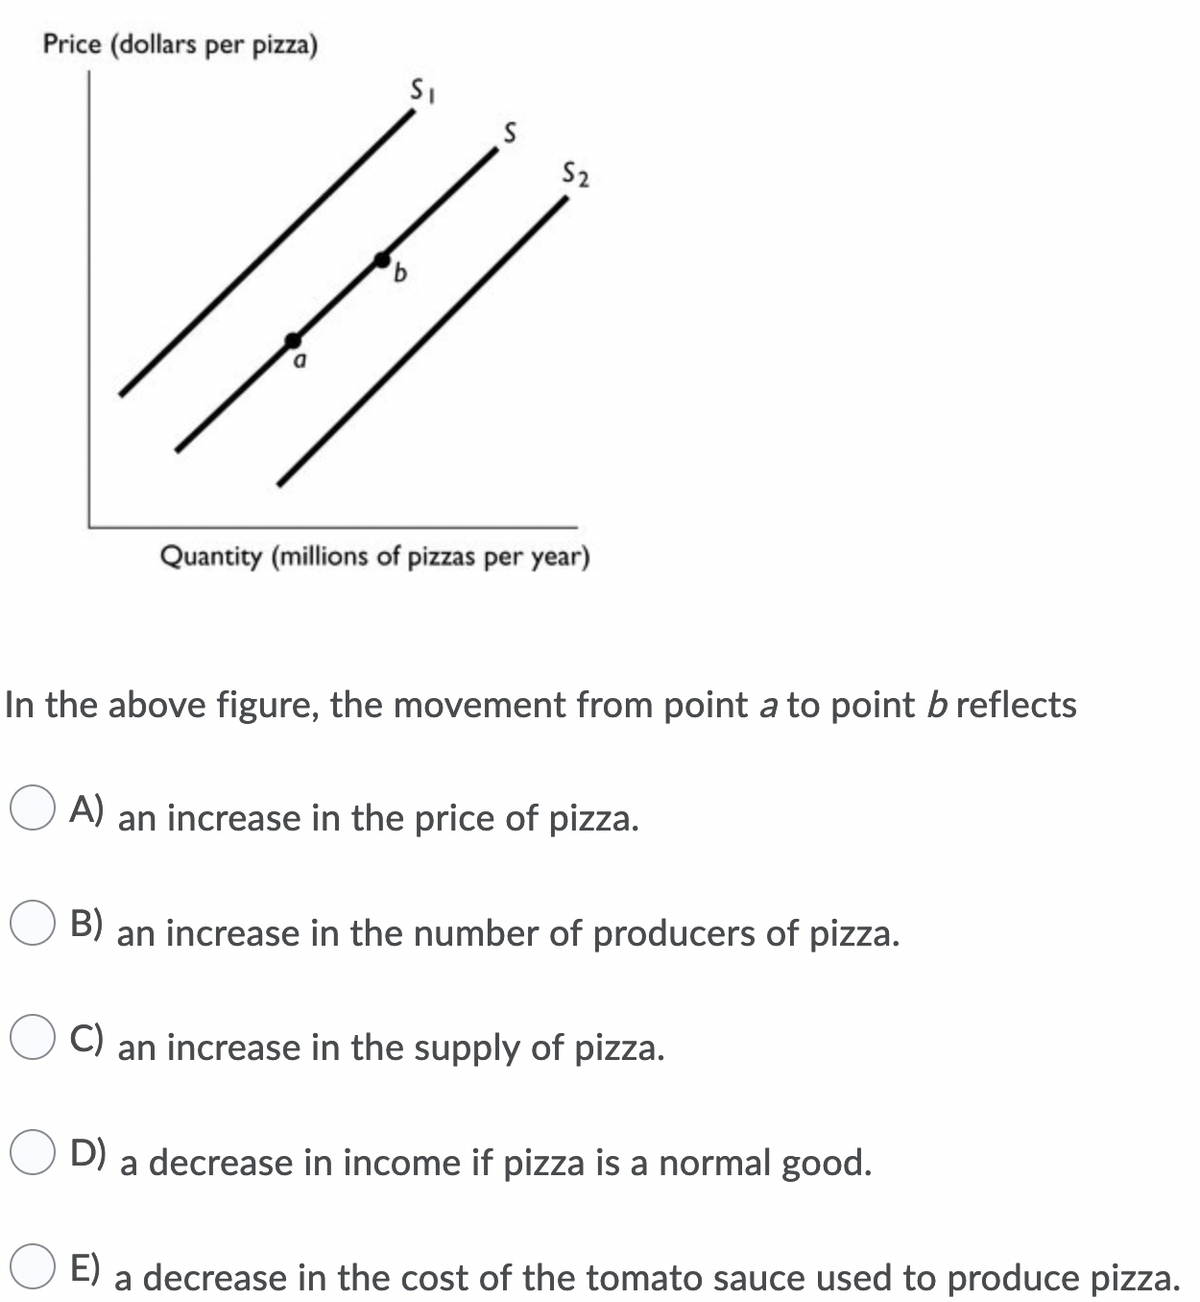
Transcribed Image Text:Price (dollars per pizza)
S
S2
9.
Quantity (millions of pizzas per year)
In the above figure, the movement from point a to point b reflects
J A) an increase in the price of pizza.
B) an increase in the number of producers of pizza.
C) an increase in the supply of pizza.
D) a decrease in income if pizza is a normal good.
E) a decrease in the cost of the tomato sauce used to produce pizza.
Expert Solution
Step 1
Supply curve is positively sloped that depicts direct relationship between price and quantity supplied.

Trending now
This is a popular solution!

Step by step
Solved in 2 steps

Knowledge Booster


Learn more about
Need a deep-dive on the concept behind this application? Look no further. Learn more about this topic, economics and related others by exploring similar questions and additional content below.Recommended textbooks for you
Principles of Macroeconomics (MindTap Course List)
Economics
ISBN:
9781285165912
Author:
N. Gregory Mankiw
Publisher:
Cengage Learning


Principles of Macroeconomics (MindTap Course List)
Economics
ISBN:
9781285165912
Author:
N. Gregory Mankiw
Publisher:
Cengage Learning


