efer to Table S6.1 - Factors for Computing_Control Chart Limits (3 sigma) for this problem. ampling 4 pieces of precision-cut wire (to be used in computer assembly) every hour for the past 24 hours has produced the following results: Hour R Hour Hour R Hour 1 3.25" 0.71" 7 3.05" 0.58" 13 3.21" 0.85" 19 3.31" 1.66" 2 3.20 1.18 8 2.65 1.13 14 2.93 1.31 20 2.79 1.09 3 3.12 1.38 3.12 0.71 15 3.22 1.01 21 2.75 1.13 4 3.29 1.26 10 2.95 1.38 16 2.94 0.45 22 3.28 0.51 5 3.17 1.17 11 2.93 1.17 17 2.96 1.48 23 3.04 1.53 6 2.86 0.42 12 2.97 0.35 18 2.64 1.34 24 2.54 1.02 ased on the sampling done, the control limits for 3-sigma x chart are (round all intermediate calculations to three decimal places before proceeding with further calculations): Upper Control Limit (UCL;) = 3.761 inches (round your response to three decimal places). Lower Control Limit (LCL-) = 2.259 inches (round your response to three decimal places). Based on the x-chart, the wire cutting process has been IN CONTROL he control limits for the 3-sigma R-chart are (round all intermediate calculations to three decimal places before proceeding with further calculations): Upper Control Limit (UCLR) = inches (round your response to three decimal places).
efer to Table S6.1 - Factors for Computing_Control Chart Limits (3 sigma) for this problem. ampling 4 pieces of precision-cut wire (to be used in computer assembly) every hour for the past 24 hours has produced the following results: Hour R Hour Hour R Hour 1 3.25" 0.71" 7 3.05" 0.58" 13 3.21" 0.85" 19 3.31" 1.66" 2 3.20 1.18 8 2.65 1.13 14 2.93 1.31 20 2.79 1.09 3 3.12 1.38 3.12 0.71 15 3.22 1.01 21 2.75 1.13 4 3.29 1.26 10 2.95 1.38 16 2.94 0.45 22 3.28 0.51 5 3.17 1.17 11 2.93 1.17 17 2.96 1.48 23 3.04 1.53 6 2.86 0.42 12 2.97 0.35 18 2.64 1.34 24 2.54 1.02 ased on the sampling done, the control limits for 3-sigma x chart are (round all intermediate calculations to three decimal places before proceeding with further calculations): Upper Control Limit (UCL;) = 3.761 inches (round your response to three decimal places). Lower Control Limit (LCL-) = 2.259 inches (round your response to three decimal places). Based on the x-chart, the wire cutting process has been IN CONTROL he control limits for the 3-sigma R-chart are (round all intermediate calculations to three decimal places before proceeding with further calculations): Upper Control Limit (UCLR) = inches (round your response to three decimal places).

Big Ideas Math A Bridge To Success Algebra 1: Student Edition 2015
1st Edition
ISBN:9781680331141
Author:HOUGHTON MIFFLIN HARCOURT
Publisher:HOUGHTON MIFFLIN HARCOURT
Chapter11: Data Analysis And Displays
Section: Chapter Questions
Problem 5CT

Related questions
Question
100%
~h3q3b
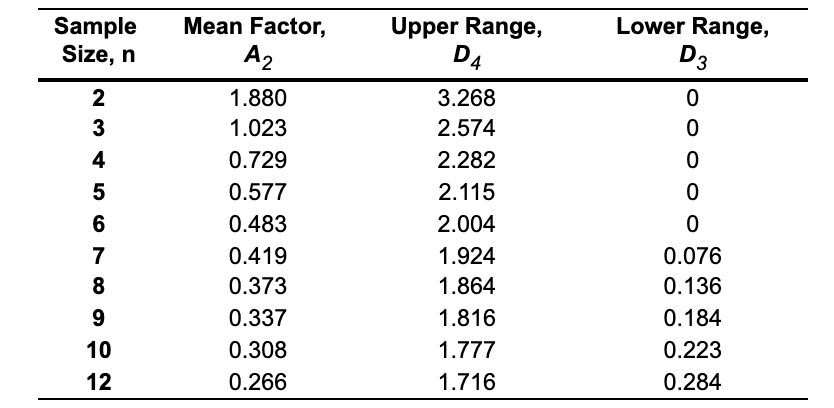
Transcribed Image Text:Mean Factor,
Lower Range,
Sample
Size, n
Upper Range,
D4
A2
D3
2
1.880
3.268
3
1.023
2.574
4
0.729
2.282
5
0.577
2.115
6
0.483
2.004
7
0.419
1.924
0.076
8
0.373
1.864
0.136
9.
0.337
1.816
0.184
10
0.308
1.777
0.223
12
0.266
1.716
0.284
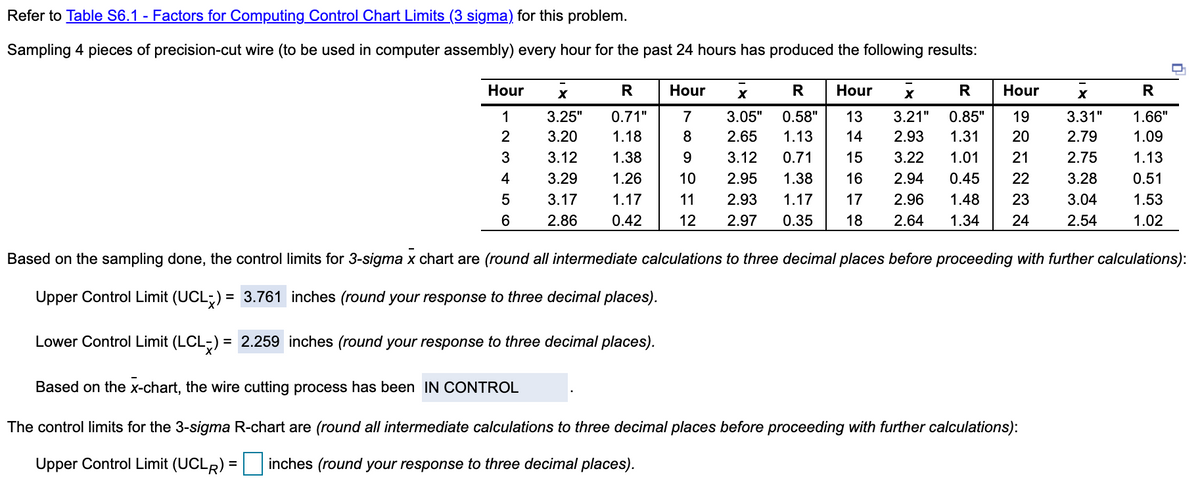
Transcribed Image Text:Refer to Table S6.1 - Factors for Computing Control Chart Limits (3 sigma) for this problem.
Sampling 4 pieces of precision-cut wire (to be used in computer assembly) every hour for the past 24 hours has produced the following results:
-
Hour
R
Hour
R
Hour
R
Hour
R
1
3.25"
0.71"
7
3.05"
0.58"
13
3.21"
0.85"
19
3.31"
1.66"
2
3.20
1.18
8
2.65
1.13
14
2.93
1.31
20
2.79
1.09
3.12
1.38
9.
3.12
0.71
15
3.22
1.01
21
2.75
1.13
4
3.29
1.26
10
2.95
1.38
16
2.94
0.45
22
3.28
0.51
3.17
1.17
11
2.93
1.17
17
2.96
1.48
23
3.04
1.53
2.86
0.42
12
2.97
0.35
18
2.64
1.34
24
2.54
1.02
Based on the sampling done, the control limits for 3-sigma x chart are (round all intermediate calculations to three decimal places before proceeding with further calculations):
Upper Control Limit (UCL;) = 3.761 inches (round your response to three decimal places).
%3D
Lower Control Limit (LCL-) = 2.259 inches (round your response to three decimal places).
Based on the x-chart, the wire cutting process has been IN CONTROL
The control limits for the 3-sigma R-chart are (round all intermediate calculations to three decimal places before proceeding with further calculations):
Upper Control Limit (UCLR) = inches (round your response to three decimal places).
Expert Solution
This question has been solved!
Explore an expertly crafted, step-by-step solution for a thorough understanding of key concepts.

This is a popular solution!

Trending now
This is a popular solution!

Step by step
Solved in 2 steps

Recommended textbooks for you
Big Ideas Math A Bridge To Success Algebra 1: Stu…
Algebra
ISBN:
9781680331141
Author:
HOUGHTON MIFFLIN HARCOURT
Publisher:
Houghton Mifflin Harcourt

Glencoe Algebra 1, Student Edition, 9780079039897…
Algebra
ISBN:
9780079039897
Author:
Carter
Publisher:
McGraw Hill

Big Ideas Math A Bridge To Success Algebra 1: Stu…
Algebra
ISBN:
9781680331141
Author:
HOUGHTON MIFFLIN HARCOURT
Publisher:
Houghton Mifflin Harcourt
Glencoe Algebra 1, Student Edition, 9780079039897…
Algebra
ISBN:
9780079039897
Author:
Carter
Publisher:
McGraw Hill