egression of the form given below in order to eva eturns of a sample of firms. You run a cross-section ri = B₁ + B₂Si + Ui
egression of the form given below in order to eva eturns of a sample of firms. You run a cross-section ri = B₁ + B₂Si + Ui

Functions and Change: A Modeling Approach to College Algebra (MindTap Course List)
6th Edition
ISBN:9781337111348
Author:Bruce Crauder, Benny Evans, Alan Noell
Publisher:Bruce Crauder, Benny Evans, Alan Noell
Chapter3: Straight Lines And Linear Functions
Section3.CR: Chapter Review Exercises
Problem 16CR: XYZ Corporation Stock Prices The following table shows the average stock price, in dollars, of XYZ...

Related questions
Question
Hi how can I work out question 1 (b) ?
Transcribed Image Text:Question 1
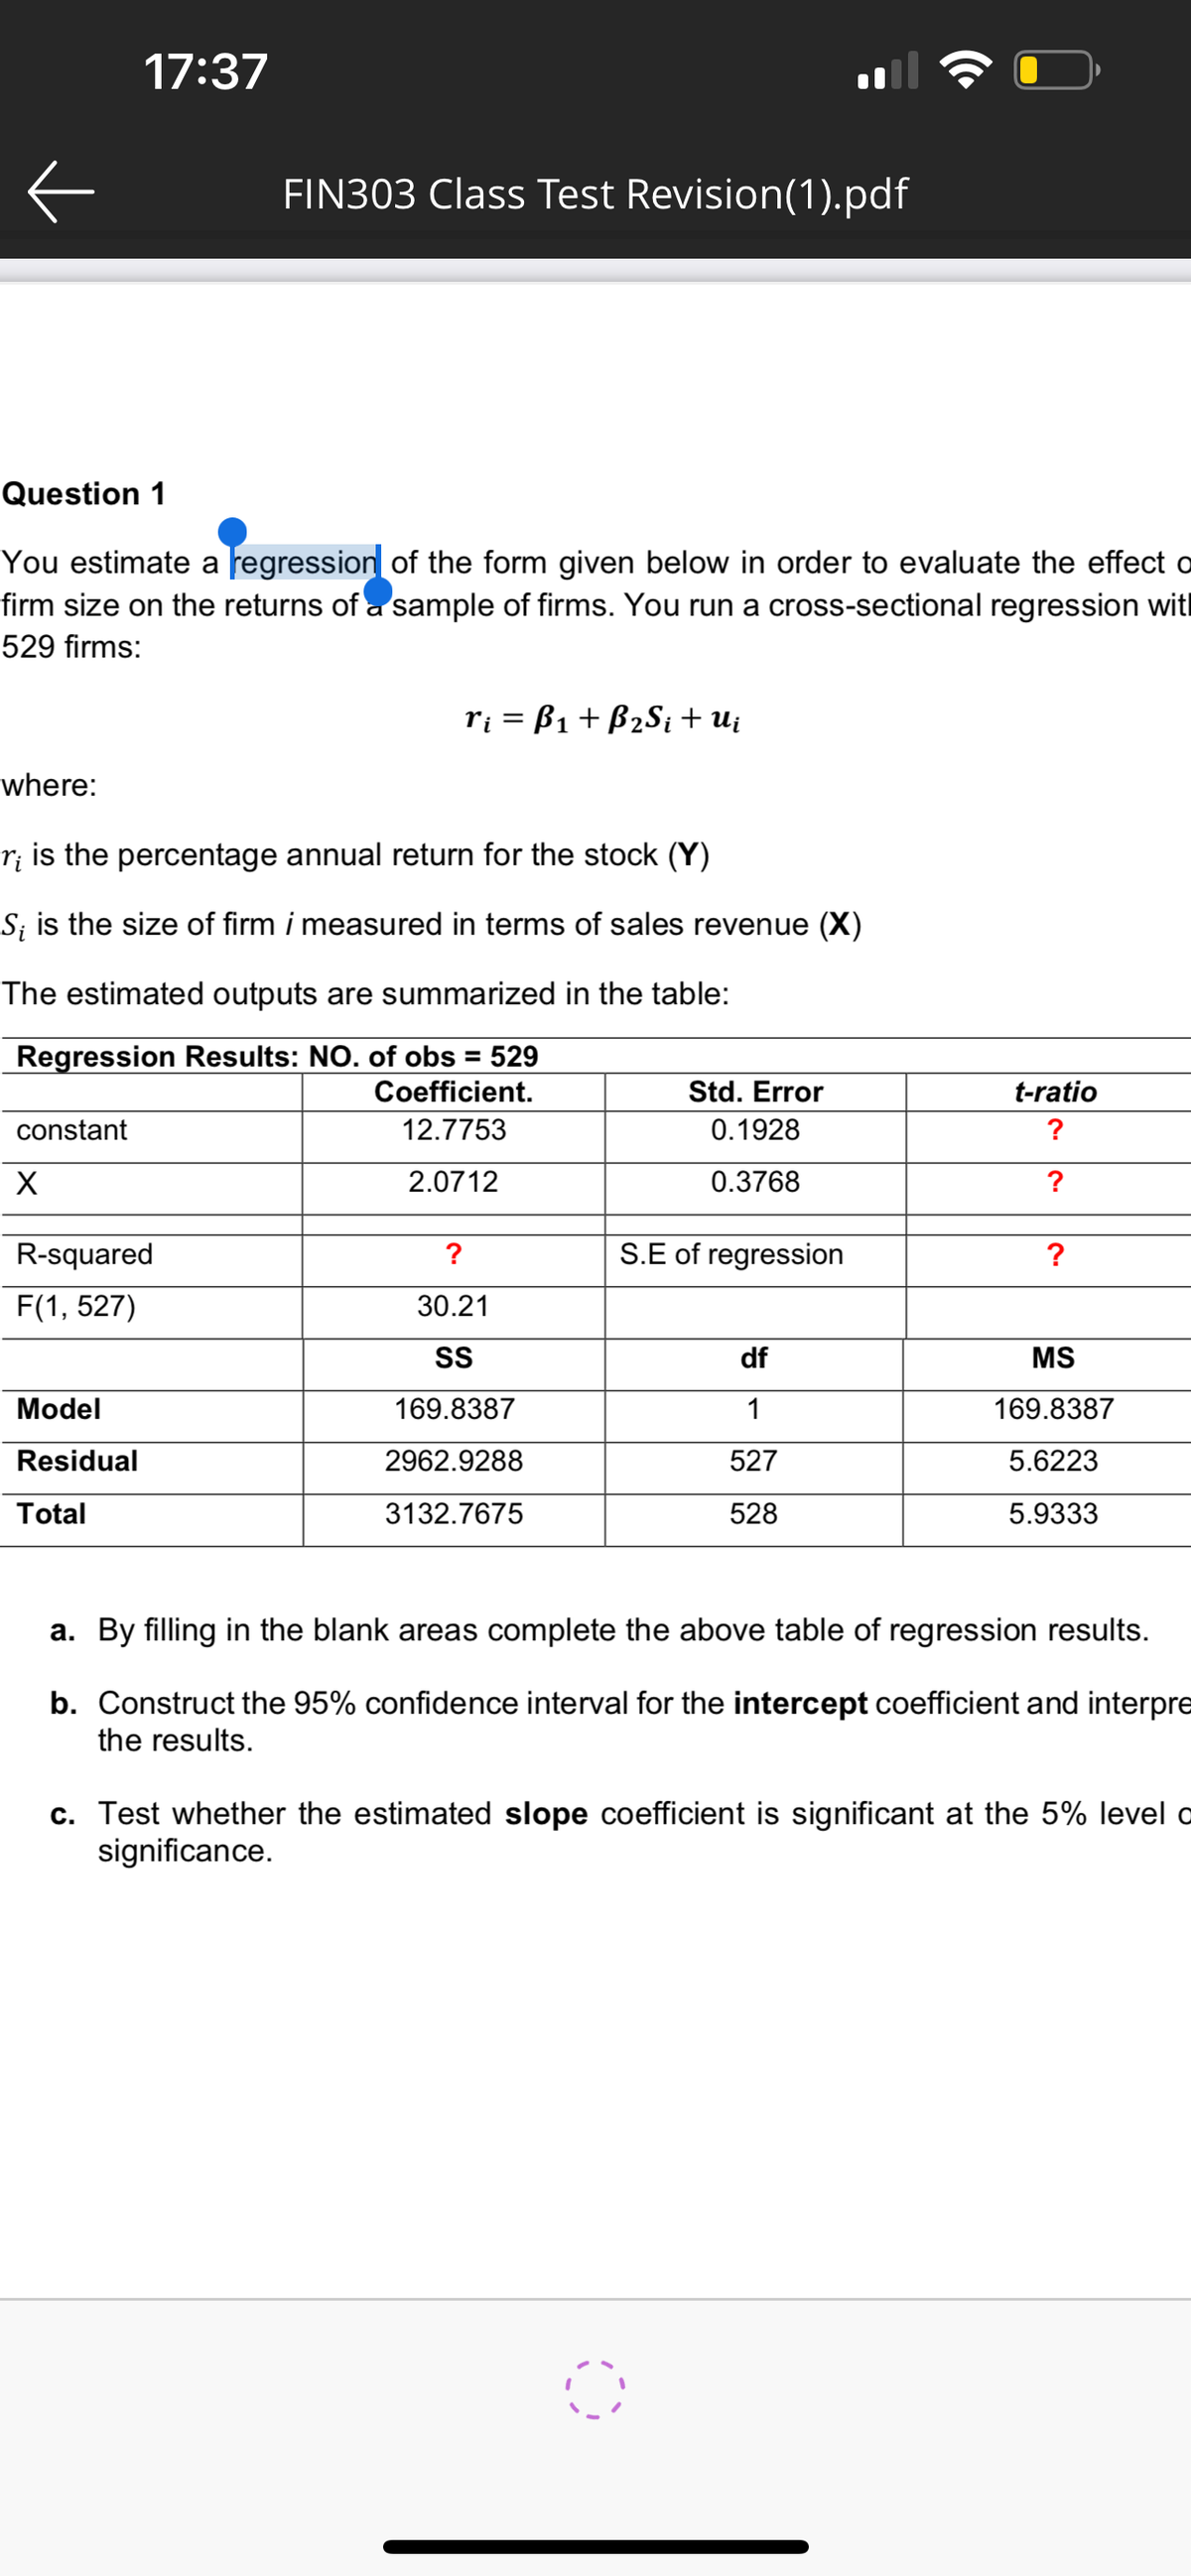
You estimate a regression of the form given below in order to evaluate the effect o
firm size on the returns of a sample of firms. You run a cross-sectional regression wit
529 firms:
constant
17:37
X
where:
r¡ is the percentage annual return for the stock (Y)
S; is the size of firm i measured in terms of sales revenue (X)
The estimated outputs are summarized in the table:
Regression Results: NO. of obs = 529
Coefficient.
12.7753
2.0712
FIN303 Class Test Revision(1).pdf
R-squared
F(1, 527)
Model
Residual
Total
ri = B₁ + B₂Si + Ui
?
30.21
SS
169.8387
2962.9288
3132.7675
Std. Error
0.1928
0.3768
S.E of regression
df
1
527
528
t-ratio
?
?
?
MS
169.8387
5.6223
5.9333
a. By filling in the blank areas complete the above table of regression results.
b. Construct the 95% confidence interval for the intercept coefficient and interpre
the results.
c. Test whether the estimated slope coefficient is significant at the 5% level o
significance.
Expert Solution
This question has been solved!
Explore an expertly crafted, step-by-step solution for a thorough understanding of key concepts.

Step by step
Solved in 2 steps with 2 images

Recommended textbooks for you
Functions and Change: A Modeling Approach to Coll…
Algebra
ISBN:
9781337111348
Author:
Bruce Crauder, Benny Evans, Alan Noell
Publisher:
Cengage Learning

Glencoe Algebra 1, Student Edition, 9780079039897…
Algebra
ISBN:
9780079039897
Author:
Carter
Publisher:
McGraw Hill

Algebra & Trigonometry with Analytic Geometry
Algebra
ISBN:
9781133382119
Author:
Swokowski
Publisher:
Cengage
Functions and Change: A Modeling Approach to Coll…
Algebra
ISBN:
9781337111348
Author:
Bruce Crauder, Benny Evans, Alan Noell
Publisher:
Cengage Learning
Glencoe Algebra 1, Student Edition, 9780079039897…
Algebra
ISBN:
9780079039897
Author:
Carter
Publisher:
McGraw Hill
Algebra & Trigonometry with Analytic Geometry
Algebra
ISBN:
9781133382119
Author:
Swokowski
Publisher:
Cengage

Algebra and Trigonometry (MindTap Course List)
Algebra
ISBN:
9781305071742
Author:
James Stewart, Lothar Redlin, Saleem Watson
Publisher:
Cengage Learning
