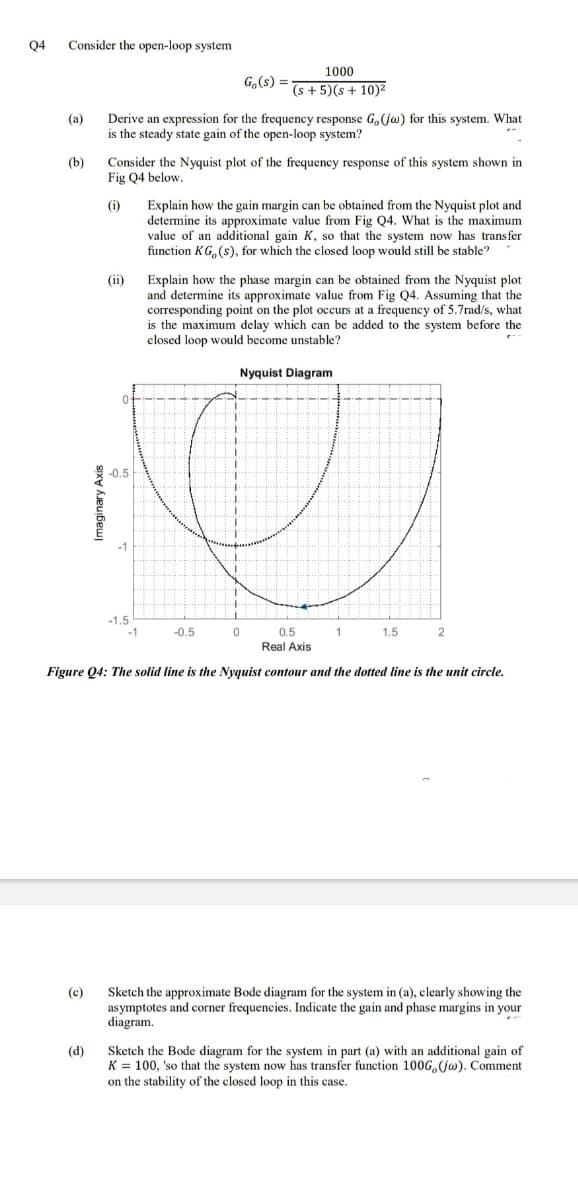
Q4 Consider the open-loop system 1000 G,(s) = (s + 5)(s+ 10)² (а) Derive an expression for the frequency response G,(jw) for this system. What is the steady state gain of the open-loop system? (b) Consider the Nyquist plot of the frequency response of this system shown in Fig Q4 below. (i) Explain how the gain margin can be obtained from the Nyquist plot and determine its approximate value from Fig Q4. What is the maximum value of an additional gain K, so that the system now has transfer function KG, (s), for which the closed loop would still be stable? (ii) Explain how the phase margin can be obtained from the Nyquist plot and determine its approximate value from Fig Q4. Assuming that the corresponding point on the plot occurs at a frequency of 5.7rad/s, what is the maximum delay which can be added to the system before the closed loop would become unstable? Nyquist Diagram -1.5 -1 -0.5 0.5 1.5 Real Axis Figure 04: The solid line is the Nyguist contour and the dotted line is the unit circle. Sketch the approximate Bode diagram for the system in (a), clearly showing the asymptotes and corner frequencies. Indicate the gain and phase margins in your diagram. (c) (d) Sketch the Bode diagram for the system in part (a) with an additional gain of K = 100, 'so that the system now has transfer function 100G,(jw). Comment on the stability of the closed loop in this case. Imaginary Axis
Q4 Consider the open-loop system 1000 G,(s) = (s + 5)(s+ 10)² (а) Derive an expression for the frequency response G,(jw) for this system. What is the steady state gain of the open-loop system? (b) Consider the Nyquist plot of the frequency response of this system shown in Fig Q4 below. (i) Explain how the gain margin can be obtained from the Nyquist plot and determine its approximate value from Fig Q4. What is the maximum value of an additional gain K, so that the system now has transfer function KG, (s), for which the closed loop would still be stable? (ii) Explain how the phase margin can be obtained from the Nyquist plot and determine its approximate value from Fig Q4. Assuming that the corresponding point on the plot occurs at a frequency of 5.7rad/s, what is the maximum delay which can be added to the system before the closed loop would become unstable? Nyquist Diagram -1.5 -1 -0.5 0.5 1.5 Real Axis Figure 04: The solid line is the Nyguist contour and the dotted line is the unit circle. Sketch the approximate Bode diagram for the system in (a), clearly showing the asymptotes and corner frequencies. Indicate the gain and phase margins in your diagram. (c) (d) Sketch the Bode diagram for the system in part (a) with an additional gain of K = 100, 'so that the system now has transfer function 100G,(jw). Comment on the stability of the closed loop in this case. Imaginary Axis

Introductory Circuit Analysis (13th Edition)
13th Edition
ISBN:9780133923605
Author:Robert L. Boylestad
Publisher:Robert L. Boylestad
Chapter1: Introduction
Section: Chapter Questions
Problem 1P: Visit your local library (at school or home) and describe the extent to which it provides literature...

Related questions
Question
Transcribed Image Text:Q4
Consider the open-loop system
1000
G,(s) =
(s + 5)(s+ 10)²
(а)
Derive an expression for the frequency response G,(jw) for this system. What
is the steady state gain of the open-loop system?
(b)
Consider the Nyquist plot of the frequency response of this system shown in
Fig Q4 below.
(i)
Explain how the gain margin can be obtained from the Nyquist plot and
determine its approximate value from Fig Q4. What is the maximum
value of an additional gain K, so that the system now has transfer
function KG, (s), for which the closed loop would still be stable?
(ii)
Explain how the phase margin can be obtained from the Nyquist plot
and determine its approximate value from Fig Q4. Assuming that the
corresponding point on the plot occurs at a frequency of 5.7rad/s, what
is the maximum delay which can be added to the system before the
closed loop would become unstable?
Nyquist Diagram
-1.5
-1
-0.5
0.5
1.5
Real Axis
Figure 04: The solid line is the Nyguist contour and the dotted line is the unit circle.
Sketch the approximate Bode diagram for the system in (a), clearly showing the
asymptotes and corner frequencies. Indicate the gain and phase margins in your
diagram.
(c)
(d)
Sketch the Bode diagram for the system in part (a) with an additional gain of
K = 100, 'so that the system now has transfer function 100G,(jw). Comment
on the stability of the closed loop in this case.
Imaginary Axis
Expert Solution
This question has been solved!
Explore an expertly crafted, step-by-step solution for a thorough understanding of key concepts.

This is a popular solution!

Trending now
This is a popular solution!

Step by step
Solved in 5 steps with 5 images

Recommended textbooks for you
Introductory Circuit Analysis (13th Edition)
Electrical Engineering
ISBN:
9780133923605
Author:
Robert L. Boylestad
Publisher:
PEARSON

Delmar's Standard Textbook Of Electricity
Electrical Engineering
ISBN:
9781337900348
Author:
Stephen L. Herman
Publisher:
Cengage Learning

Programmable Logic Controllers
Electrical Engineering
ISBN:
9780073373843
Author:
Frank D. Petruzella
Publisher:
McGraw-Hill Education
Introductory Circuit Analysis (13th Edition)
Electrical Engineering
ISBN:
9780133923605
Author:
Robert L. Boylestad
Publisher:
PEARSON
Delmar's Standard Textbook Of Electricity
Electrical Engineering
ISBN:
9781337900348
Author:
Stephen L. Herman
Publisher:
Cengage Learning
Programmable Logic Controllers
Electrical Engineering
ISBN:
9780073373843
Author:
Frank D. Petruzella
Publisher:
McGraw-Hill Education

Fundamentals of Electric Circuits
Electrical Engineering
ISBN:
9780078028229
Author:
Charles K Alexander, Matthew Sadiku
Publisher:
McGraw-Hill Education

Electric Circuits. (11th Edition)
Electrical Engineering
ISBN:
9780134746968
Author:
James W. Nilsson, Susan Riedel
Publisher:
PEARSON

Engineering Electromagnetics
Electrical Engineering
ISBN:
9780078028151
Author:
Hayt, William H. (william Hart), Jr, BUCK, John A.
Publisher:
Mcgraw-hill Education,