Electricity_Sales Number_of_Customers Price Degree_Days 1,144,781 690,044.7 6.7651 547.4338 1,143,784 693,866.5 6.8928 -26.3267 1,184,600 697,890.9 6.8626 -1.6835 1,139,054 701,234.3 6.2738 12.4116 1,204,495 704,746.5 6.1591 606.3047 1,179,366 709,583.7 6.2017 148.1826 1,085,489 713,389.1 6.5480 -2.0032 1,160,943 717,401.4 5.9404 -83.5602 1,158,592 721,355.7 5.8960 66.9503 1,193,556 724,228.1 6.0853 24.2879 1,202,514 727,191.2 6.2554 -0.9467 1,174,335 729,230.4 6.3808 -56.3871 1,174,335 731,584.4 6.2768 -360.9842 1,161,770 734,456.2 6.5243 -192.4087 1,142,863 737,848.2 6.4216 -2.8573 1,196,627 739,084.7 6.2837 -168.6407 1,236,468 740,332.7 6.1659 551.9068 1,188,673 741,904.4 6.0801 55.7721 1,181,075 743,467.6 6.9015 -2.5041 1,203,114 743,895.9 6.4296 -159.8219 1,168,515 745,209.2 6.9283 -610.3438 1,224,423 748,664.4 6.4846 113.5806 1,417,430 751,690.6 6.2845 1.2786 1,255,205 755,482.9 6.9084 96.0549 1,251,512 758,648.6 6.8695 251.5787 1,245,558 762,147.7 6.3565 29.6604 a. Estimate a regression equation with electricity sales as the dependent variable, using the number of customers and the price as predictor variables. Interpret the coefficients. Part 2 Multiple regression models with k independent variables have the form shown below, where β0 is the Y intercept, βn is the slope of Y with variable Xn when all other variables are held constant, and εi is the random error in Y for observation i. yi=β0+β1x1i+β2x2i+...+βKxKi+εi Part 3 Notice that this data set has only two independent variables. The multiple regression equation with two independent variables has the form shown below, where b0, b1, and b2 are the sample regression coefficients of the population parameters β0, β1, and β2. Yi=b0+b1X1i+b2X2i Part 4 Use technology to determine a multiple regression equation, rounding to one decimal place. Let Y be estimated electricity sales, X1 be the number of customers, and X2 be the price. Y=410,032.1+0.5X1+64,375.8X2 Part 5 Interpret the coefficients of the regression equation. Regression coefficients in a multiple regression are called net regression coefficients; they estimate the mean change in Y per unit change in a particular X, holding constant the effect of the other X variables. Use the information and the values determined in the previous step to correctly interpret the coefficients of the regression equation. Part 6 b. Estimate a regression equation (electricity sales) using only number of customers as a predictor variable. Interpret the coefficient and compare the result from part a. Part 7 Notice that this data set has only one independent variable. The regression equation with one independent variable has the form shown below, where b0 and b1 are the sample regression coefficients of the population parameters β0 and β1. Yi=b0+b1X1i Part 8 Use technology to determine a regression equation, rounding to one decimal place. Let Y be estimated electricity sales, and X1 be the number of customers. Y=1,072,293+0.2X1 Part 9 Interpret the coefficients of the regression equation. Regression coefficients in a regression equation are called net regression coefficients; they estimate the mean change in Y per unit change in a particular X. Use the information and the values determined in the previous step to correctly interpret the coefficients of the regression equation. Part 10 Compare the coefficient for the number of customers found in part a to the coefficient for the number of customers found in part b. Part 11 The coefficient for the number of customers in part a, 0.5, is greater than the coefficient for the number of customers found in part b, 0.2. Part 12 c. Estimate a regression equation (electricity sales) using the price and degree days as predictor variables. Interpret the coefficients. Compare the coefficient for price with that obtained in part a. Part 13 Notice that this data set has only two independent variables. The multiple regression equation with two independent variables has the form shown below, where b0, b1, and b2 are the sample regression coefficients of the population parameters β0, β1, and β2. Yi=b0+b1X1i+b2X2i Part 14 Use technology to determine a multiple regression equation, rounding to one decimal place. Let Y be estimated electricity sales, X1 be the price, and X2 be the degree days. Y=905,564.3+48,321.8X1+143.7X2 Part 15 Interpret the coefficients of regression equation. Regression coefficients in a multiple regression are called net regression coefficients; they estimate the mean change in Y per unit change in a particular X, holding constant the effect of the other X variables. Use the information and the values determined in the previous step to correctly interpret the coefficients of the regression equation. Part 16
Electricity_Sales Number_of_Customers Price Degree_Days 1,144,781 690,044.7 6.7651 547.4338 1,143,784 693,866.5 6.8928 -26.3267 1,184,600 697,890.9 6.8626 -1.6835 1,139,054 701,234.3 6.2738 12.4116 1,204,495 704,746.5 6.1591 606.3047 1,179,366 709,583.7 6.2017 148.1826 1,085,489 713,389.1 6.5480 -2.0032 1,160,943 717,401.4 5.9404 -83.5602 1,158,592 721,355.7 5.8960 66.9503 1,193,556 724,228.1 6.0853 24.2879 1,202,514 727,191.2 6.2554 -0.9467 1,174,335 729,230.4 6.3808 -56.3871 1,174,335 731,584.4 6.2768 -360.9842 1,161,770 734,456.2 6.5243 -192.4087 1,142,863 737,848.2 6.4216 -2.8573 1,196,627 739,084.7 6.2837 -168.6407 1,236,468 740,332.7 6.1659 551.9068 1,188,673 741,904.4 6.0801 55.7721 1,181,075 743,467.6 6.9015 -2.5041 1,203,114 743,895.9 6.4296 -159.8219 1,168,515 745,209.2 6.9283 -610.3438 1,224,423 748,664.4 6.4846 113.5806 1,417,430 751,690.6 6.2845 1.2786 1,255,205 755,482.9 6.9084 96.0549 1,251,512 758,648.6 6.8695 251.5787 1,245,558 762,147.7 6.3565 29.6604 a. Estimate a regression equation with electricity sales as the dependent variable, using the number of customers and the price as predictor variables. Interpret the coefficients. Part 2 Multiple regression models with k independent variables have the form shown below, where β0 is the Y intercept, βn is the slope of Y with variable Xn when all other variables are held constant, and εi is the random error in Y for observation i. yi=β0+β1x1i+β2x2i+...+βKxKi+εi Part 3 Notice that this data set has only two independent variables. The multiple regression equation with two independent variables has the form shown below, where b0, b1, and b2 are the sample regression coefficients of the population parameters β0, β1, and β2. Yi=b0+b1X1i+b2X2i Part 4 Use technology to determine a multiple regression equation, rounding to one decimal place. Let Y be estimated electricity sales, X1 be the number of customers, and X2 be the price. Y=410,032.1+0.5X1+64,375.8X2 Part 5 Interpret the coefficients of the regression equation. Regression coefficients in a multiple regression are called net regression coefficients; they estimate the mean change in Y per unit change in a particular X, holding constant the effect of the other X variables. Use the information and the values determined in the previous step to correctly interpret the coefficients of the regression equation. Part 6 b. Estimate a regression equation (electricity sales) using only number of customers as a predictor variable. Interpret the coefficient and compare the result from part a. Part 7 Notice that this data set has only one independent variable. The regression equation with one independent variable has the form shown below, where b0 and b1 are the sample regression coefficients of the population parameters β0 and β1. Yi=b0+b1X1i Part 8 Use technology to determine a regression equation, rounding to one decimal place. Let Y be estimated electricity sales, and X1 be the number of customers. Y=1,072,293+0.2X1 Part 9 Interpret the coefficients of the regression equation. Regression coefficients in a regression equation are called net regression coefficients; they estimate the mean change in Y per unit change in a particular X. Use the information and the values determined in the previous step to correctly interpret the coefficients of the regression equation. Part 10 Compare the coefficient for the number of customers found in part a to the coefficient for the number of customers found in part b. Part 11 The coefficient for the number of customers in part a, 0.5, is greater than the coefficient for the number of customers found in part b, 0.2. Part 12 c. Estimate a regression equation (electricity sales) using the price and degree days as predictor variables. Interpret the coefficients. Compare the coefficient for price with that obtained in part a. Part 13 Notice that this data set has only two independent variables. The multiple regression equation with two independent variables has the form shown below, where b0, b1, and b2 are the sample regression coefficients of the population parameters β0, β1, and β2. Yi=b0+b1X1i+b2X2i Part 14 Use technology to determine a multiple regression equation, rounding to one decimal place. Let Y be estimated electricity sales, X1 be the price, and X2 be the degree days. Y=905,564.3+48,321.8X1+143.7X2 Part 15 Interpret the coefficients of regression equation. Regression coefficients in a multiple regression are called net regression coefficients; they estimate the mean change in Y per unit change in a particular X, holding constant the effect of the other X variables. Use the information and the values determined in the previous step to correctly interpret the coefficients of the regression equation. Part 16

Functions and Change: A Modeling Approach to College Algebra (MindTap Course List)
6th Edition
ISBN:9781337111348
Author:Bruce Crauder, Benny Evans, Alan Noell
Publisher:Bruce Crauder, Benny Evans, Alan Noell
Chapter3: Straight Lines And Linear Functions
Section3.CR: Chapter Review Exercises
Problem 15CR: Life Expectancy The following table shows the average life expectancy, in years, of a child born in...

Related questions
Question
Electricity_Sales Number_of_Customers Price Degree_Days
1,144,781 690,044.7 6.7651 547.4338
1,143,784 693,866.5 6.8928 -26.3267
1,184,600 697,890.9 6.8626 -1.6835
1,139,054 701,234.3 6.2738 12.4116
1,204,495 704,746.5 6.1591 606.3047
1,179,366 709,583.7 6.2017 148.1826
1,085,489 713,389.1 6.5480 -2.0032
1,160,943 717,401.4 5.9404 -83.5602
1,158,592 721,355.7 5.8960 66.9503
1,193,556 724,228.1 6.0853 24.2879
1,202,514 727,191.2 6.2554 -0.9467
1,174,335 729,230.4 6.3808 -56.3871
1,174,335 731,584.4 6.2768 -360.9842
1,161,770 734,456.2 6.5243 -192.4087
1,142,863 737,848.2 6.4216 -2.8573
1,196,627 739,084.7 6.2837 -168.6407
1,236,468 740,332.7 6.1659 551.9068
1,188,673 741,904.4 6.0801 55.7721
1,181,075 743,467.6 6.9015 -2.5041
1,203,114 743,895.9 6.4296 -159.8219
1,168,515 745,209.2 6.9283 -610.3438
1,224,423 748,664.4 6.4846 113.5806
1,417,430 751,690.6 6.2845 1.2786
1,255,205 755,482.9 6.9084 96.0549
1,251,512 758,648.6 6.8695 251.5787
1,245,558 762,147.7 6.3565 29.6604
a. Estimate a regression equation with electricity sales as the dependent variable, using the number of customers and the price as predictor variables. Interpret the coefficients.
Part 2
Multiple regression models with k independent variables have the form shown below, where
β0
is the Y intercept,
βn
is the slope of Y with variable
Xn
when all other variables are held constant, and
εi
is the random error in Y for observation i.yi=β0+β1x1i+β2x2i+...+βKxKi+εi
Part 3
Notice that this data set has only two independent variables. The multiple regression equation with two independent variables has the form shown below, where
b0,
b1,
and
b2
are the sample regression coefficients of the population parameters
β0,
β1,
and β2.Yi=b0+b1X1i+b2X2i
Part 4
Use technology to determine a multiple regression equation, rounding to one decimal place. Let
Y
be estimated electricity sales,
X1
be the number of customers, and
X2
be the price.Y=410,032.1+0.5X1+64,375.8X2
Part 5
Interpret the coefficients of the regression equation.
Regression coefficients in a multiple regression are called net regression coefficients; they estimate the mean change in Y per unit change in a particular X, holding constant the effect of the other X variables. Use the information and the values determined in the previous step to correctly interpret the coefficients of the regression equation.
Part 6
b. Estimate a regression equation (electricity sales) using only number of customers as a predictor variable. Interpret the coefficient and compare the result from part a.
Part 7
Notice that this data set has only one independent variable. The regression equation with one independent variable has the form shown below, where
b0
and
b1
are the sample regression coefficients of the population parameters
β0
and
β1.
Yi=b0+b1X1i
Part 8
Use technology to determine a regression equation, rounding to one decimal place. Let
Y
be estimated electricity sales, and
X1
be the number of customers.Y=1,072,293+0.2X1
Part 9
Interpret the coefficients of the regression equation.
Regression coefficients in a regression equation are called net regression coefficients; they estimate the mean change in Y per unit change in a particular X. Use the information and the values determined in the previous step to correctly interpret the coefficients of the regression equation.
Part 10
Compare the coefficient for the number of customers found in part a to the coefficient for the number of customers found in part b.
Part 11
The coefficient for the number of customers in part a,
0.5,
is
greater than
the coefficient for the number of customers found in part b,
0.2.
Part 12
c. Estimate a regression equation (electricity sales) using the price and degree days as predictor variables. Interpret the coefficients. Compare the coefficient for price with that obtained in part a.
Part 13
Notice that this data set has only two independent variables. The multiple regression equation with two independent variables has the form shown below, where
b0,
b1,
and
b2
are the sample regression coefficients of the population parameters
β0,
β1,
and β2.Yi=b0+b1X1i+b2X2i
Part 14
Use technology to determine a multiple regression equation, rounding to one decimal place. Let
Y
be estimated electricity sales,
X1
be the price, and
X2
be the degree days.Y=905,564.3+48,321.8X1+143.7X2
Part 15
Interpret the coefficients of regression equation.
Regression coefficients in a multiple regression are called net regression coefficients; they estimate the mean change in Y per unit change in a particular X, holding constant the effect of the other X variables. Use the information and the values determined in the previous step to correctly interpret the coefficients of the regression equation.
Part 16
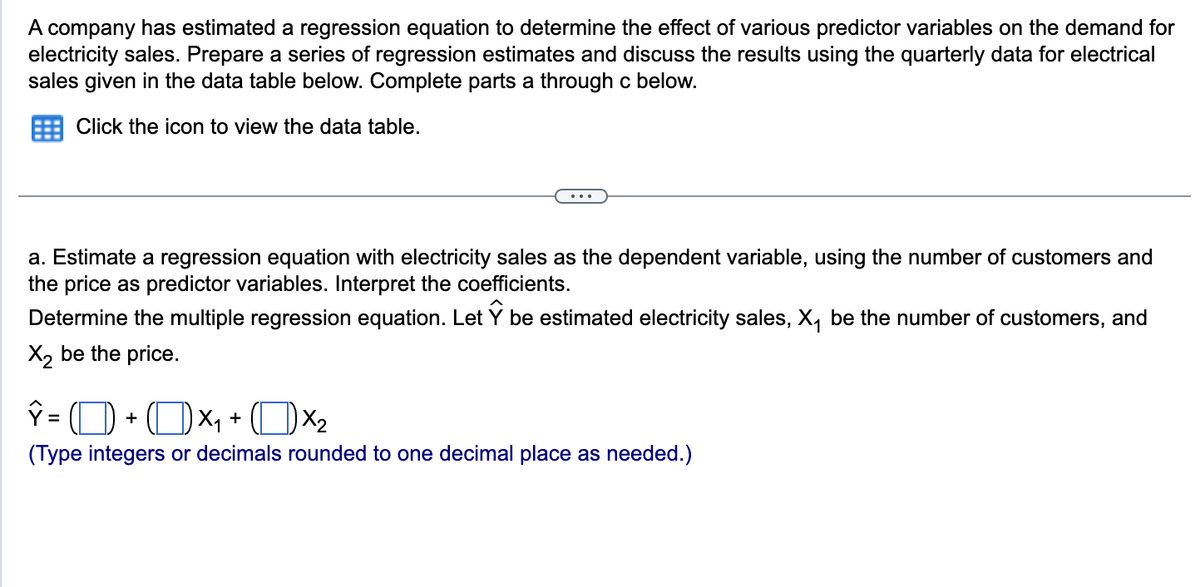
Transcribed Image Text:A company has estimated a regression equation to determine the effect of various predictor variables on the demand for
electricity sales. Prepare a series of regression estimates and discuss the results using the quarterly data for electrical
sales given in the data table below. Complete parts a through c below.
Click the icon to view the data table.
a. Estimate a regression equation with electricity sales as the dependent variable, using the number of customers and
the price as predictor variables. Interpret the coefficients.
Determine the multiple regression equation. Let be estimated electricity sales, X₁ be the number of customers, and
X₂ be the price.
ý = ( D) + ( D x + (Dx
(Type integers or decimals rounded to one decimal place as needed.)
Expert Solution
This question has been solved!
Explore an expertly crafted, step-by-step solution for a thorough understanding of key concepts.

Step by step
Solved in 3 steps with 2 images

Follow-up Questions
Read through expert solutions to related follow-up questions below.
Follow-up Question
b. Estimate a regression equation (electricity sales) using only number of customers as a predictor variable. Interpret the coefficient and compare the result from part a.
Determine the multiple regression equation. Let
Y
be estimated electricity sales, and
X1
be the number of customers.Y=enter your response here+enter your response hereX1
(Type integers or decimals rounded to one decimal place as needed.)
Solution
Recommended textbooks for you
Functions and Change: A Modeling Approach to Coll…
Algebra
ISBN:
9781337111348
Author:
Bruce Crauder, Benny Evans, Alan Noell
Publisher:
Cengage Learning

Algebra and Trigonometry (MindTap Course List)
Algebra
ISBN:
9781305071742
Author:
James Stewart, Lothar Redlin, Saleem Watson
Publisher:
Cengage Learning

Glencoe Algebra 1, Student Edition, 9780079039897…
Algebra
ISBN:
9780079039897
Author:
Carter
Publisher:
McGraw Hill
Functions and Change: A Modeling Approach to Coll…
Algebra
ISBN:
9781337111348
Author:
Bruce Crauder, Benny Evans, Alan Noell
Publisher:
Cengage Learning
Algebra and Trigonometry (MindTap Course List)
Algebra
ISBN:
9781305071742
Author:
James Stewart, Lothar Redlin, Saleem Watson
Publisher:
Cengage Learning
Glencoe Algebra 1, Student Edition, 9780079039897…
Algebra
ISBN:
9780079039897
Author:
Carter
Publisher:
McGraw Hill

