en} be a random sample of e. e~ N(0, o²), where o >0. Let Y, = a+ e;, for Let {e,, e2, ', i = 1, ·.,nand some a > 0. To estimate the unknown parameter a with data {y, the following estimator G: ', Yn} , consider n G 25Y,+ max{Y 1, Y m} Y n} 3n Which of the following statements is correct? O a. G is an unbiased estimator. O b. E(G) = 0 O C. E(G) > a O d. E(G) < a O e. G is an biased estimator, but there is no way to know that whether E(G) < 0 or E(G) > 0.
en} be a random sample of e. e~ N(0, o²), where o >0. Let Y, = a+ e;, for Let {e,, e2, ', i = 1, ·.,nand some a > 0. To estimate the unknown parameter a with data {y, the following estimator G: ', Yn} , consider n G 25Y,+ max{Y 1, Y m} Y n} 3n Which of the following statements is correct? O a. G is an unbiased estimator. O b. E(G) = 0 O C. E(G) > a O d. E(G) < a O e. G is an biased estimator, but there is no way to know that whether E(G) < 0 or E(G) > 0.

A First Course in Probability (10th Edition)
10th Edition
ISBN:9780134753119
Author:Sheldon Ross
Publisher:Sheldon Ross
Chapter1: Combinatorial Analysis
Section: Chapter Questions
Problem 1.1P: a. How many different 7-place license plates are possible if the first 2 places are for letters and...

Related questions
Question
Transcribed Image Text:for
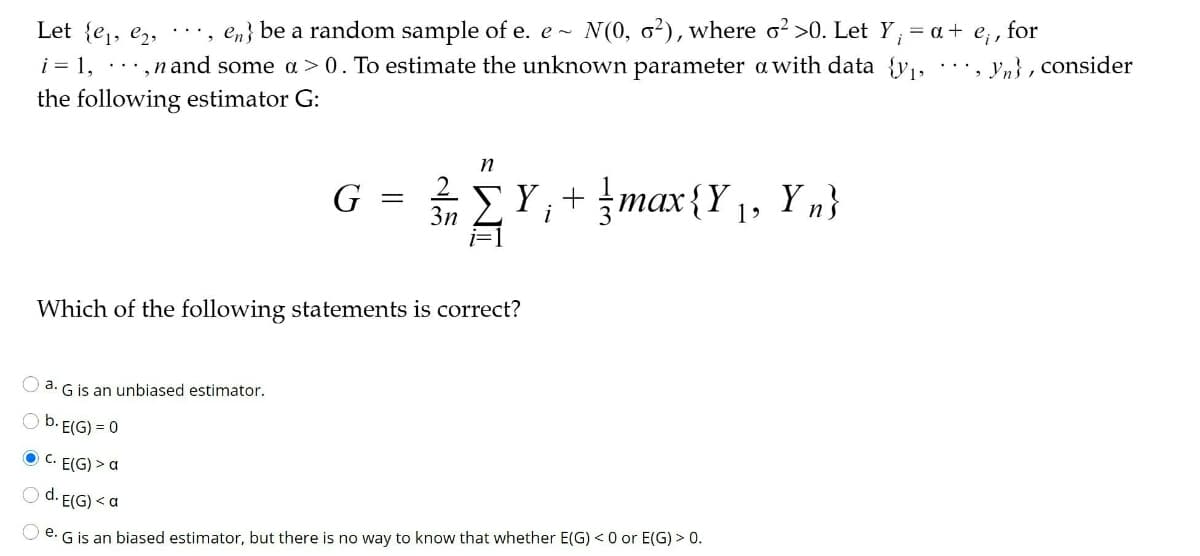
, en} be a random sample of e. e -
N (0, o?), where o? >0. Let Y, = a +
Let {e1, e2,
i = 1,
...,n and some a > 0. To estimate the unknown parameter a with data {y, ., yn}, consider
the following estimator G:
ΣΥ,+ Jmax (Υ), Υ)
max{Y 1, Y n}
G
3n
Which of the following statements is correct?
O a. G is an unbiased estimator.
O b. E(G) = 0
O C. E(G) > a
O d. E(G) < a
O e. G is an biased estimator, but there is no way to know that whether E(G) < 0 or E(G) > 0.
Expert Solution
This question has been solved!
Explore an expertly crafted, step-by-step solution for a thorough understanding of key concepts.

Step by step
Solved in 2 steps

Knowledge Booster


Learn more about
Need a deep-dive on the concept behind this application? Look no further. Learn more about this topic, probability and related others by exploring similar questions and additional content below.Recommended textbooks for you
A First Course in Probability (10th Edition)
Probability
ISBN:
9780134753119
Author:
Sheldon Ross
Publisher:
PEARSON

A First Course in Probability (10th Edition)
Probability
ISBN:
9780134753119
Author:
Sheldon Ross
Publisher:
PEARSON