Suppose that X ~ N(7, 2.25). Data x is an observed IID sample of size n = 500 from the distribution of X. That is, the IID Data Model is: x + X, where X ~ IID(500) X ~ IID(500) N(7,2.25). (a) Give a rough sketch of your guess at the density histogram of data x, including labeled tick marks on the horizontal axis. Explain why you expect the density histogram of the data x to look this way. (b) The sample mean x and the sample variance s2 of these 500 data values were computed. What would you guess their values are and why?
Suppose that X ~ N(7, 2.25). Data x is an observed IID sample of size n = 500 from the distribution of X. That is, the IID Data Model is: x + X, where X ~ IID(500) X ~ IID(500) N(7,2.25). (a) Give a rough sketch of your guess at the density histogram of data x, including labeled tick marks on the horizontal axis. Explain why you expect the density histogram of the data x to look this way. (b) The sample mean x and the sample variance s2 of these 500 data values were computed. What would you guess their values are and why?

MATLAB: An Introduction with Applications
6th Edition
ISBN:9781119256830
Author:Amos Gilat
Publisher:Amos Gilat
Chapter1: Starting With Matlab
Section: Chapter Questions
Problem 1P

Related questions
Question
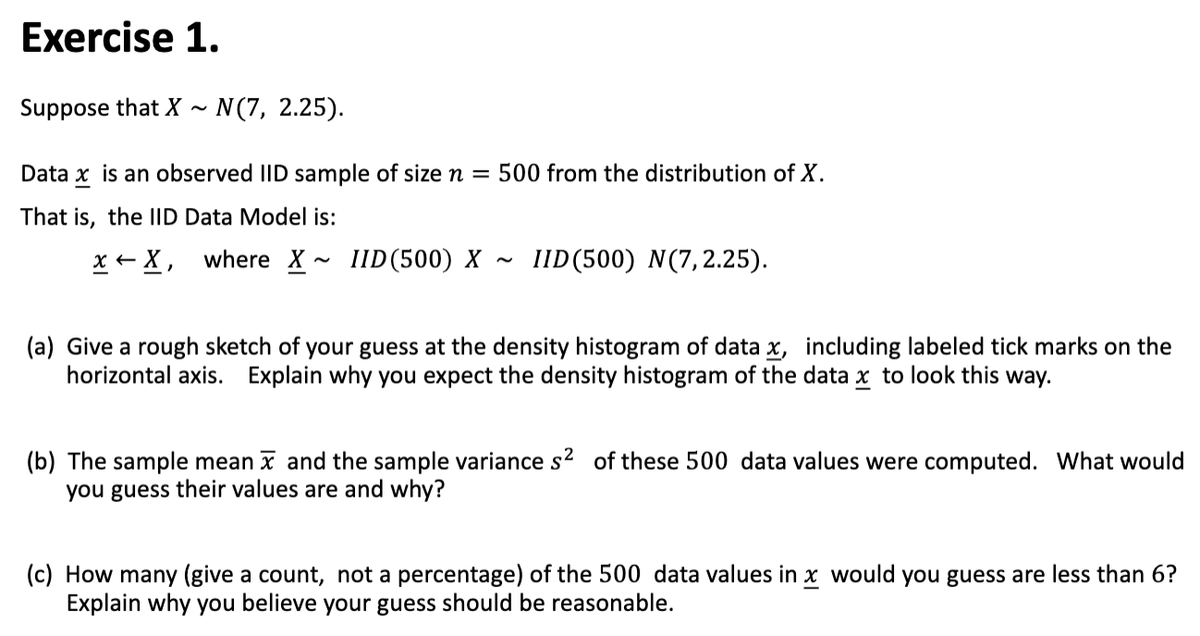
Transcribed Image Text:Exercise 1.
Suppose that X ~ N(7, 2.25).
Data x is an observed IID sample of size n = 500 from the distribution of X.
That is, the IID Data Model is:
x + X, where X - IID(500) X
IID(500) N(7,2.25).
(a) Give a rough sketch of your guess at the density histogram of data x, including labeled tick marks on the
horizontal axis. Explain why you expect the density histogram of the data x to look this way.
(b) The sample mean x and the sample variance s2 of these 500 data values were computed. What would
you guess their values are and why?
(c) How many (give a count, not a percentage) of the 500 data values in x would you guess are less than 6?
Explain why you believe your guess should be reasonable.
Expert Solution
This question has been solved!
Explore an expertly crafted, step-by-step solution for a thorough understanding of key concepts.

This is a popular solution!

Trending now
This is a popular solution!

Step by step
Solved in 2 steps with 2 images

Recommended textbooks for you
MATLAB: An Introduction with Applications
Statistics
ISBN:
9781119256830
Author:
Amos Gilat
Publisher:
John Wiley & Sons Inc

Probability and Statistics for Engineering and th…
Statistics
ISBN:
9781305251809
Author:
Jay L. Devore
Publisher:
Cengage Learning

Statistics for The Behavioral Sciences (MindTap C…
Statistics
ISBN:
9781305504912
Author:
Frederick J Gravetter, Larry B. Wallnau
Publisher:
Cengage Learning
MATLAB: An Introduction with Applications
Statistics
ISBN:
9781119256830
Author:
Amos Gilat
Publisher:
John Wiley & Sons Inc
Probability and Statistics for Engineering and th…
Statistics
ISBN:
9781305251809
Author:
Jay L. Devore
Publisher:
Cengage Learning
Statistics for The Behavioral Sciences (MindTap C…
Statistics
ISBN:
9781305504912
Author:
Frederick J Gravetter, Larry B. Wallnau
Publisher:
Cengage Learning

Elementary Statistics: Picturing the World (7th E…
Statistics
ISBN:
9780134683416
Author:
Ron Larson, Betsy Farber
Publisher:
PEARSON

The Basic Practice of Statistics
Statistics
ISBN:
9781319042578
Author:
David S. Moore, William I. Notz, Michael A. Fligner
Publisher:
W. H. Freeman

Introduction to the Practice of Statistics
Statistics
ISBN:
9781319013387
Author:
David S. Moore, George P. McCabe, Bruce A. Craig
Publisher:
W. H. Freeman