enough water for the growing population. The city council needs to decide whether to The table shows the amount of water consumed by the city over a 7-year period. (An build a new reservoir to sustain the water needs of the growing town. authority is closely monitoring water usage to make sure the reservoir will provide 8. REINFORCE The town of Benton is experiencing a population increase. The local water Exploring "Representing data" Page 6 of 7 foot.) Year 2008 2009 2010 2011 2012 2013 2014 Acre-feet of water 60 76 92 100 108 68 84 consumed (in hundreds) The head of the local water authority, Rob Salinas, is preparing a neutral presentation to the city council. His assistant created three graphs of average yearly water use for him to choose from. Graph C Graph B Graph A 200 Years aince 2008 Water uned (100 ot ITTT
enough water for the growing population. The city council needs to decide whether to The table shows the amount of water consumed by the city over a 7-year period. (An build a new reservoir to sustain the water needs of the growing town. authority is closely monitoring water usage to make sure the reservoir will provide 8. REINFORCE The town of Benton is experiencing a population increase. The local water Exploring "Representing data" Page 6 of 7 foot.) Year 2008 2009 2010 2011 2012 2013 2014 Acre-feet of water 60 76 92 100 108 68 84 consumed (in hundreds) The head of the local water authority, Rob Salinas, is preparing a neutral presentation to the city council. His assistant created three graphs of average yearly water use for him to choose from. Graph C Graph B Graph A 200 Years aince 2008 Water uned (100 ot ITTT

Algebra for College Students
10th Edition
ISBN:9781285195780
Author:Jerome E. Kaufmann, Karen L. Schwitters
Publisher:Jerome E. Kaufmann, Karen L. Schwitters
Chapter11: Systems Of Equations
Section11.CT: Test
Problem 24CT

Related questions
Question
Helpp plzzzzxx
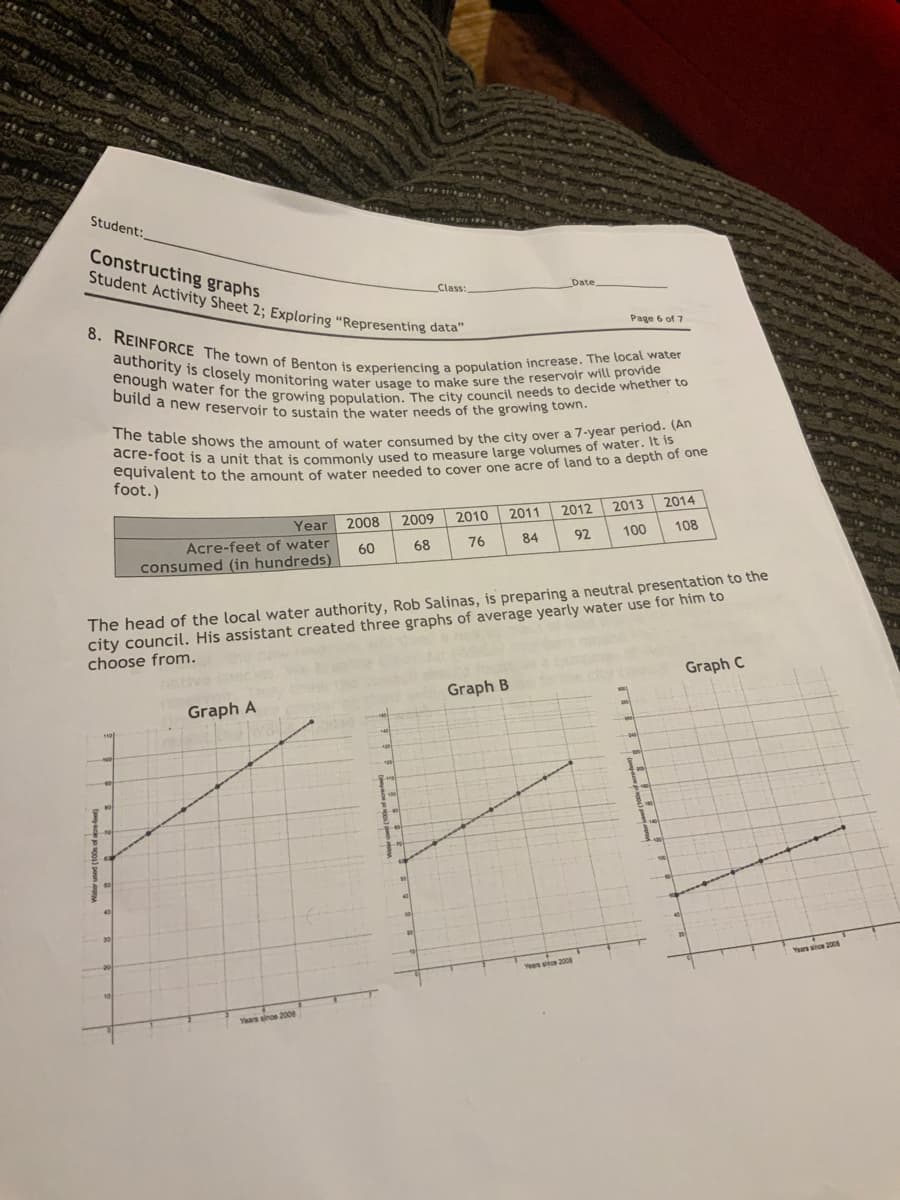
Transcribed Image Text:The table shows the amount of water consumed by the city over a 7-year period. (An
enough water for the growing population. The city council needs to decide whether to
authority is closely monitoring water usage to make sure the reservoir will provide
build a new reservoir to sustain the water needs of the growing town.
8. REINFORCE The town of Benton is experiencing a population increase. The local water
Student:
Constructing graphs
Student Activity Sheet 2: Exploring "Representing de
Class:
Date
Page 6 of 7
equivalent to the amount of water needed to cover one acre of land to a depth of one
foot.)
2013
2014
Year
2008
2009
2010
2011
2012
92
100
108
Acre-feet of water
60
68
76
84
consumed (in hundreds)
The head of the local water authority, Rob Salinas, is preparing a neutral presentation to the
city council. His assistant created three graphs of average yearly water use for him to
choose from.
Graph C
Graph B
Graph A
Years ainoe 2008
Expert Solution
This question has been solved!
Explore an expertly crafted, step-by-step solution for a thorough understanding of key concepts.

This is a popular solution!

Trending now
This is a popular solution!

Step by step
Solved in 2 steps

Recommended textbooks for you
Algebra for College Students
Algebra
ISBN:
9781285195780
Author:
Jerome E. Kaufmann, Karen L. Schwitters
Publisher:
Cengage Learning
Algebra for College Students
Algebra
ISBN:
9781285195780
Author:
Jerome E. Kaufmann, Karen L. Schwitters
Publisher:
Cengage Learning